-
Section 01
Workforce Data — Senior leadership 2021
-
Section 02
Workforce Data — Remuneration/pay 2021
-
Section 03
Workforce Data — Māori Crown 2021
-
Section 04
Workforce Data — Public sector composition 2021
-
Section 05
Workforce Data — Diversity and inclusion 2021
-
5.1
Workforce Data — Ethnicity in the Public Service 2021
-
5.2
Workforce Data — Gender representation in the Public Service 2021
-
5.3
Workforce Data — Rainbow 2021
-
5.4
Workforce Data — Disability 2021
-
5.5
Workforce Data — Age profile 2021
-
5.6
Workforce Data — Religion 2021
-
5.7
Workforce Data — Inclusion 2021
-
5.1
-
Section 06
Workforce Data — Working in the Public service 2021
-
Section 07
Guidance: Data drilldown and technical guidance 2021
The data we collect provides information about the composition of the wider public sector, the change in staff numbers by department, and how much was spent on contractors and consultants.
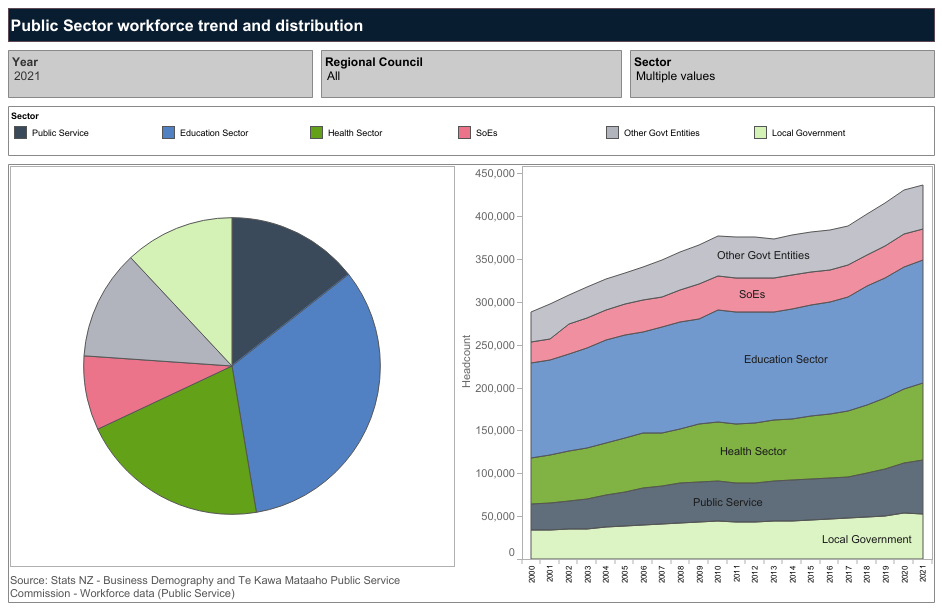
The composition of the wider public sector
The public sector employed around 436,700 people in 2021, 18.9% of New Zealand’s total workforce (2,313,400), as measured by Stats NZ’s Business Demography data. The majority (88%) work in central government (384,400) and 12% in local government (52,200).
Note that the central government sector comprises all public sector employees, except those in local government. This includes the Public Service, health sector (including District Health Boards), the education sector (including primary and secondary schools), and Crown entities.
Over the last 5 years, the overall public sector workforce increased by 13.7% (with central government up 13.9% and local government up 12.4%). This compares with an 8.9% growth in the private sector over the same period.
The sector composition of workforce varies amongst the regions (see the interactive dashboard below).
* The central government sector comprises all public sector employees, except those in local government. This includes the Public Service, health sector (including DHBs), the education sector (including primary and secondary schools), and Crown entities.
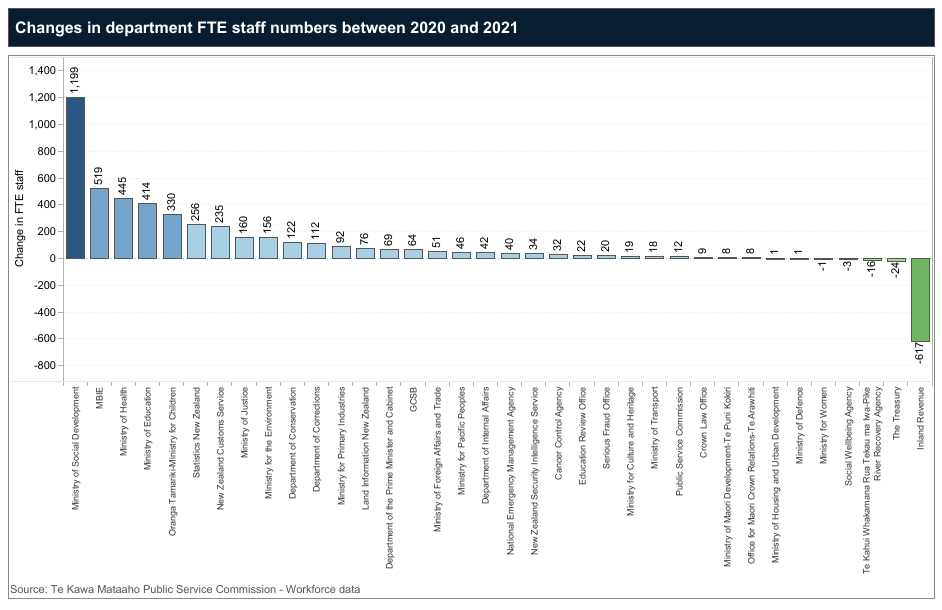
Change in staff numbers by department
There were 61,097 full-time equivalent (FTE) staff at 30 June 2021. This is an increase of 6.9% (or 3,948 FTEs) from 57,149 FTEs in 2020. The annual increase in 2020 was 8.6% (or 4,521).
Of the 36 Public Service departments and departmental agencies, 31 of them increased their FTE staff by taking on more staff, or filling roles that were vacant in June 2020. Five agencies reported a decrease.
The biggest increases in FTEs occurred at:
- The Ministry of Social Development (MSD) (up 1,199). Around 70% of this growth was to support MSD’s role in the Government’s COVID-19 response, and the resulting increased demand for its services, as well as to support Budget priorities.
- The Ministry for Business, Innovation and Employment (up 519). It was required to grow in 2021 to establish and lead the Government’s multi-agency MIQ response, with other growth necessary to deliver an expanded work programme.
- The Ministry of Health (up 445). Most workforce growth across the Ministry was to support its role in the Government’s COVID-19 response, including the establishment of the COVID-19 Response Directorate and the COVID-19 Vaccination and Immunisation Programme.
- The Ministry of Education (up 414). A focus on delivery of front-line service to support the national curriculum refresh, and delivering on the investments in improving outcomes for priority learners, including Māori learners and those with learning support needs drove workforce growth in 2021.
- Oranga Tamariki Ministry for Children (up 330). The increase follows Cabinet’s approval for significant funding to support the development of the Ministry’s new operating model to transform the care system and meet new legislative obligations.
In contrast, the largest decrease was at Inland Revenue (down 617), as it continues to right-size following implementation of its Business Transformation Programme. There has been a significant decline in the number of fixed-term staff at the Department.
Department of Corrections remains the largest Public Service department (with 9,915 FTEs), closely followed by MSD (9,172). These 2 organisations make up 31.2% of the Public Service workforce.
Contractor and consultant expenditure
In 2020/21, Public Service organisations spent a total of $939.1 million on contractors and consultants. This was a decrease of 3% on the 2019/20 spend of $967.9 million, with the decrease driven by a decrease in spending at Inland Revenue, as it continues to right-size following implementation of its Business Transformation Programme. Total expenditure comprises operational expenditure of $603.4 million (down 1% from $609.4 million in 2019/120) and capital expenditure of $335.6 million (down 6.4 % from $358.5 million in 2019/20).
Operating expenditure on contractors and consultants was 10.3% of total Public Service workforce spend ($5,874.34 million), a reduction from 11.3% in 2019/20, 12.8% in 2018/19 and 13.4% in 2017/18. This reduction was due to contractor and consultant operating expenditure increasing at a slower rate over the past year than total workforce spend. This measure represents the balance between using external resources and building capacity and capability in the Public Service.
Table 1: Contractor and consultant expenditure ($ million)
|
|
FY2019/20 |
FY2020/21 |
||||
|
Agencies |
OPEX |
CAPEX |
Total |
OPEX |
CAPEX |
Total |
|
Cancer Control Agency |
$0.4 |
none |
$0.4 |
$1.4 |
None |
$1.4 |
|
Crown Law Office |
$1.5 |
$0.1 |
$1.6 |
$1.7 |
$0.1 |
$1.8 |
|
Department of Conservation |
$12.4 |
$0.9 |
$13.3 |
$14.6 |
$2.1 |
$16.8 |
|
Department of Corrections |
$20.7 |
$25.6 |
$46.3 |
$20.0 |
$24.8 |
$44.8 |
|
Department of Internal Affairs |
$47.0 |
$29.7 |
$76.7 |
$59.2 |
$27.9 |
$87.1 |
|
Department of the Prime Minister and Cabinet |
$2.6 |
none |
$2.6 |
$7.5 |
$0.0 |
$7.5 |
|
Education Review Office |
$1.3 |
$0.2 |
$1.6 |
$1.9 |
$0.4 |
$2.4 |
|
Inland Revenue Department |
$111.5 |
$72.3 |
$183.8 |
$67.1 |
$44.2 |
$111.3 |
|
Land Information New Zealand |
$6.8 |
$4.0 |
$10.8 |
$8.2 |
$5.5 |
$13.7 |
|
Ministry for Culture and Heritage |
$4.7 |
$0.5 |
$5.2 |
$11.4 |
$0.2 |
$11.7 |
|
Ministry for Pacific Peoples |
$2.2 |
none |
$2.2 |
$1.9 |
None |
$1.9 |
|
Ministry for Primary Industries |
$50.2 |
$3.3 |
$53.5 |
$26.9 |
$4.5 |
$31.5 |
|
Ministry for the Environment |
$16.7 |
$0.2 |
$16.9 |
$23.4 |
None |
$23.5 |
|
Ministry for Women |
$0.8 |
none |
$0.8 |
$0.9 |
None |
$0.9 |
|
Ministry of Business, Innovation and Employment |
$70.2 |
$38.7 |
$108.9 |
$68.9 |
$21.5 |
$90.3 |
|
Ministry of Defence |
$1.2 |
$1.0 |
$2.2 |
$1.1 |
$0.4 |
$1.5 |
|
Ministry of Education |
$57.5 |
$109.8 |
$167.2 |
$63.1 |
$112.9 |
$176.0 |
|
Ministry of Foreign Affairs and Trade |
$14.4 |
$4.3 |
$18.7 |
$12.2 |
$5.9 |
$18.1 |
|
Ministry of Health |
$25.0 |
$17.2 |
$42.2 |
$52.8 |
$9.2 |
$62.0 |
|
Ministry of Housing and Urban Development |
$14.7 |
none |
$14.7 |
$7.9 |
None |
$7.9 |
|
Ministry of Justice |
$21.4 |
$7.1 |
$28.5 |
$19.3 |
$6.9 |
$26.2 |
|
Ministry of Māori Development-Te Puni Kōkiri |
$18.5 |
$0.7 |
$19.3 |
$17.1 |
None |
$17.1 |
|
Ministry of Social Development |
$38.5 |
$23.4 |
$61.9 |
$42.6 |
$52.2 |
$94.8 |
|
Ministry of Transport |
$16.5 |
none |
$16.5 |
$13.5 |
None |
$13.5 |
|
National Emergency Management Agency |
$0.6 |
None |
$0.6 |
$0.7 |
None |
$0.7 |
|
New Zealand Customs Service |
$6.6 |
$13.4 |
$20.1 |
$6.1 |
$11.2 |
$17.4 |
|
Office for Māori Crown Relations-Te Arawhiti |
$4.7 |
$0.0 |
$4.7 |
$3.5 |
None |
$3.5 |
|
Oranga Tamariki-Ministry for Children |
$19.6 |
$2.9 |
$22.4 |
$19.3 |
$3.9 |
$23.2 |
|
Public Service Commission |
$2.1 |
none |
$2.1 |
$2.2 |
None |
$2.2 |
|
Serious Fraud Office |
$0.5 |
none |
$0.5 |
$0.5 |
$0.05 |
$0.6 |
|
Social Wellbeing Agency |
$1.8 |
none |
$1.8 |
$2.7 |
None |
$2.7 |
|
Statistics New Zealand |
$6.6 |
$2.3 |
$8.9 |
$13.3 |
$1.3 |
$14.6 |
|
Te Kāhui Whakamana Rua Tekau mā Iwa-Pike River Recovery Agency |
$2.9 |
none |
$2.9 |
$1.5 |
None |
$1.5 |
|
The Treasury |
$7.3 |
$0.9 |
$8.2 |
$8.8 |
$0.3 |
$9.1 |
|
Total Public Service |
$609.4 |
$358.5 |
$967.9 |
$603.4 |
$335.6 |
$939.1 |
Note that some 2019/20 figures have been revised since they were first published. The reported total expenditure has changed from $974.9 million to $967.9 million.
Public Service contractor and consultant data for the 2017/18 year was the first to be published using our new guidance on how to report contractor and consultant expenditure. Before the new guidance, there was inconsistency in how organisations reported this expenditure.
Contractors and Consultants Guidance
The focus is on operating expenditure, as the large one-off investments that capital expenditure typically represents are likely to have a different mix of public servants and contractors/consultants and the resulting expenditure is likely to be volatile over time due to the fixed-term nature of these projects.
Contractor and consultant expenditure definitions
Operating expenditure (OPEX) — this is the money spent for contractors and consultants that are not for the purpose of acquiring or developing assets.
Capital expenditure (CAPEX) — this is the money spent to acquire resources to develop assets, tangible and intangible, through procurement of contractors and consultants.
Total workforce spend — this is the sum of salary expenditure for permanent and fixed-term employees, and operational expenditure on contractors and consultants.
2020 Public Service Workforce Data released
Use of contractors and consultants starts to level off
The first release was for the 2017/2018 financial year and can be located here.