-
Section 01
Workforce Data — Senior leadership 2021
-
Section 02
Workforce Data — Remuneration/pay 2021
-
Section 03
Workforce Data — Māori Crown 2021
-
Section 04
Workforce Data — Public sector composition 2021
-
Section 05
Workforce Data — Diversity and inclusion 2021
-
5.1
Workforce Data — Ethnicity in the Public Service 2021
-
5.2
Workforce Data — Gender representation in the Public Service 2021
-
5.3
Workforce Data — Rainbow 2021
-
5.4
Workforce Data — Disability 2021
-
5.5
Workforce Data — Age profile 2021
-
5.6
Workforce Data — Religion 2021
-
5.7
Workforce Data — Inclusion 2021
-
5.1
-
Section 06
Workforce Data — Working in the Public service 2021
-
Section 07
Guidance: Data drilldown and technical guidance 2021
The data we collect gives us information on job satisfaction, staff engagement, workplace injuries, turnover, leave and tenure for public servants.
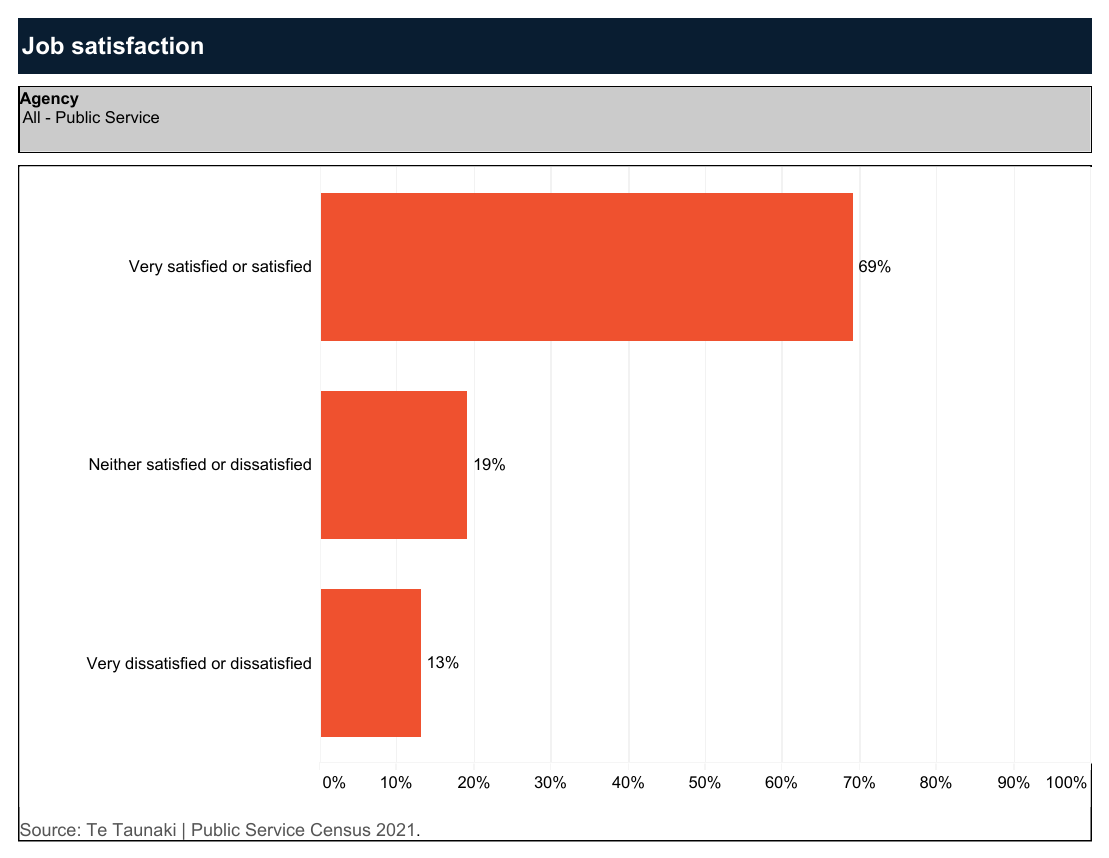
Job satisfaction
In Te Taunaki Public Service Census, 69% of the participants said they were satisfied or very satisfied with their job, and only 4% were very dissatisfied. This compares to 77% of employed New Zealanders who were satisfied with their job in the most recent General Social Survey 2018.
Wellbeing data for New Zealanders: job satisfaction — Stats NZ
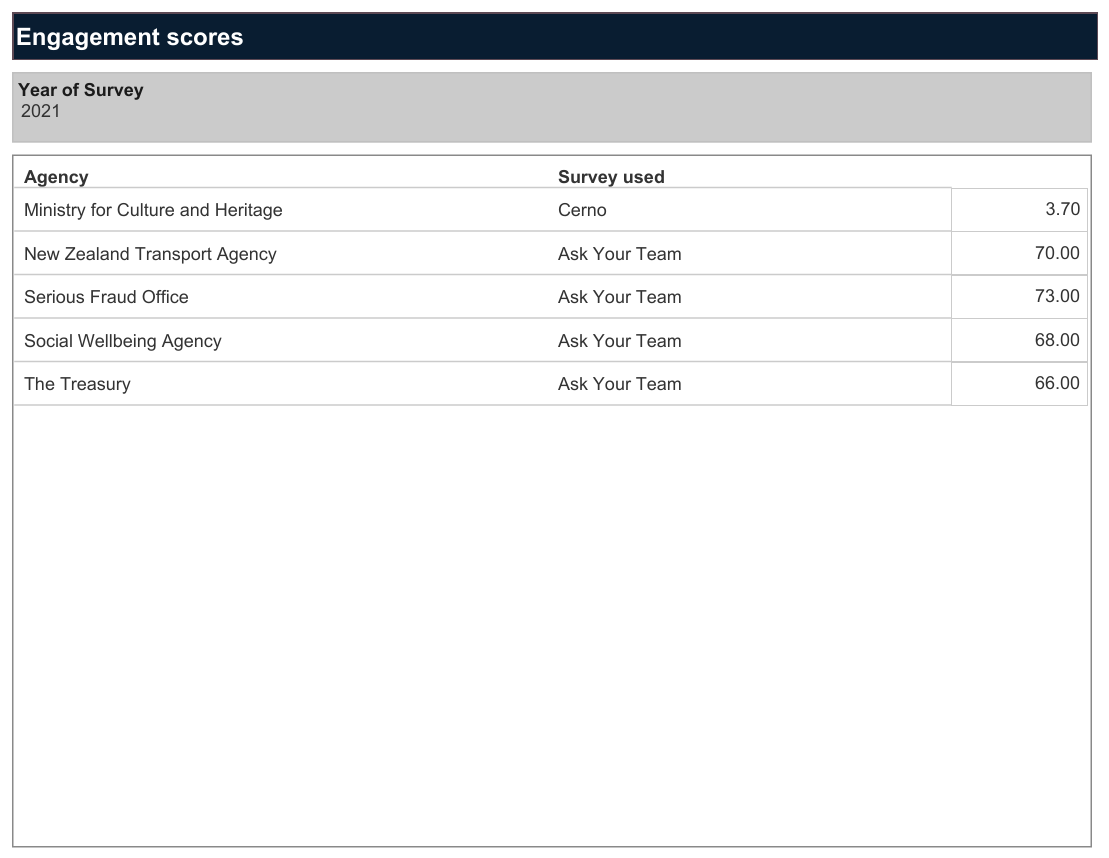
Staff engagement
Organisations regularly survey their staff to gauge the level of engagement and where to focus to lift engagement. Results from these staff engagement surveys are collected as part of the Workforce Data collection and these are published in the table below.
There are complications in comparing staff engagement results across the Public Service. First, organisations use different providers to survey staff engagement and results are not easily comparable. Second, some organisations survey staff engagement less often than others.
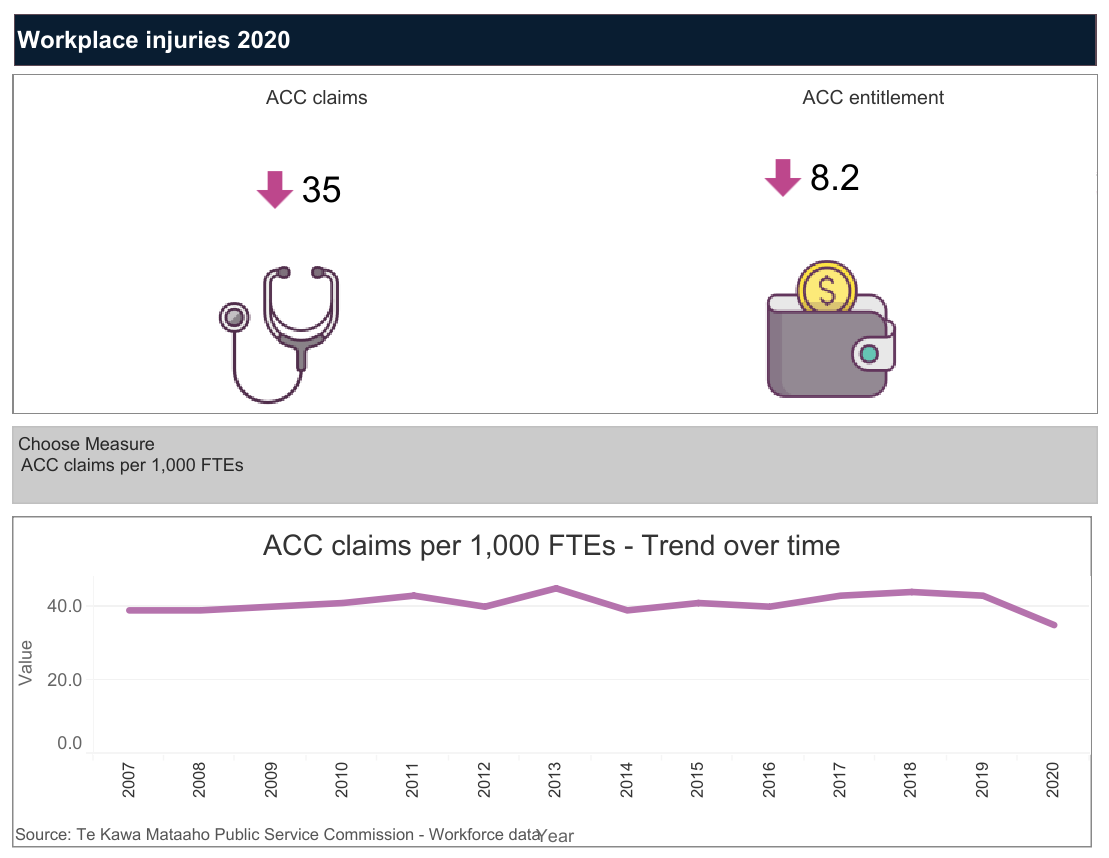
Workplace injuries
We have worked with the new health and safety functional lead, ACC and Stats NZ to produce 2 Health and Safety metrics (as shown in the visualisation below).
- All ACC claims in the Public Service per 1,000 FTEs.
- Entitlement ACC claims per 1,000 FTEs (serious claims that involve additional payments beyond medical fees).
The incidence of such claims in the Public Service workforce is around half that in the wider New Zealand workforce. Since 2007 the rate of workplace injuries resulting in an ACC work-related claim or entitlement payment has, on average, declined across New Zealand. In the Public Service, these rates have remained relatively unchanged until 2020, when both rates fell. There was also a sharp fall in all work-related claims in the wider New Zealand workforce in 2020, and Stats NZ notes that this coincided with the national COVID-19 lockdown in the first half of 2020.
The health and safety functional lead was established in August 2017 within the Public Service to work with organisations and the sector generally.
Stats NZ has the latest official workplace injury statistics.
Injury statistics: work-related claims: 2020 — Stats NZ
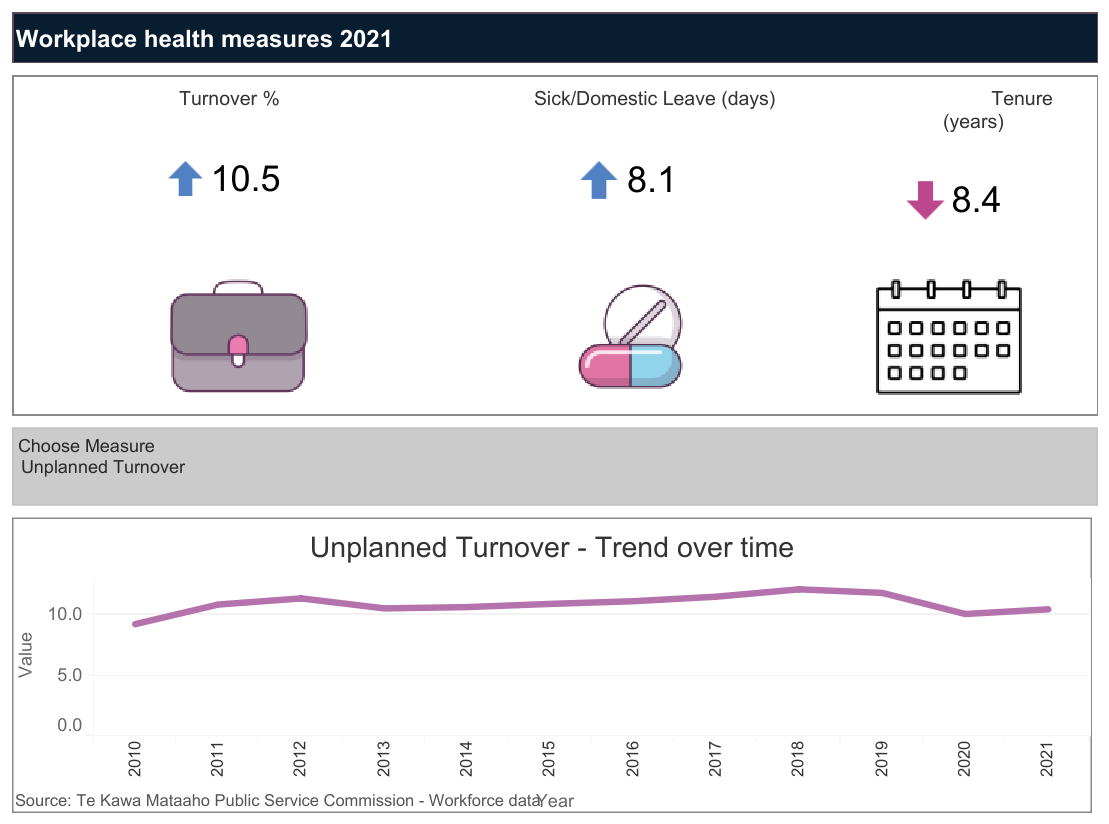
Turnover, sick and domestic leave, and tenure
Unplanned turnover measures the rate that organisations lose permanent staff due to reasons they hadn’t planned for, such as resignations, retirements and dismissals. The 2021 figure is 10.5%, which is up 0.4 percentage points from last year.
In the year to 30 June 2021, Public Service employees took on average 8.1 days of sick and domestic leave, up from 7.6 days in 2020.
The 2021 Workforce Data shows that the average length of service of Public Service employees decreased by 0.1 of a year to 8.4 years. This measure has been trending down since 2016, when it was 9.5 years. This measure is based on tenure within a single organisation, not the Public Service as a whole, and excludes those on fixed-term employment agreements.