Public Service Workforce Composition - March 2023 quarter
Public Service workforce size and composition of departments and departmental agencies has been collected annually since 2000. Recently, frequency of monitoring has been increased with agencies reporting their results quarterly. Information below sets out year to date numbers on workforce size, including FTE and contractor and consultant expenditure to 30 March 2023.
Workforce FTEs
Public Service departments and departmental agencies had 62,710 FTEs as at 31 March 2023, a 9 monthly increase of around 2,330 FTEs (or 3.9%).
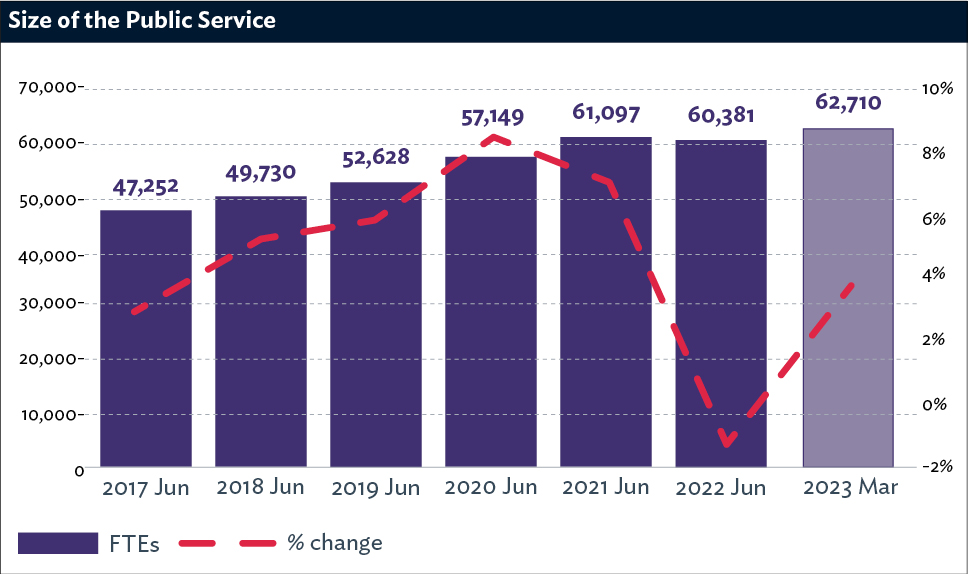
Alt = ”Chart showing how the size of the Public Service workforce in FTEs has changed since 2017, where latest growth rates are lower than in 2020 and 2021.”
Contractor and consultant expenditure
We use a proportional measure (i.e., spending as a percentage of total spending on the Public Service workforce) to assess the level of out-sourcing by the Public Service. This is a more useful measure than raw dollar spend as it is a more accurate description of the level of outsourcing by the Public Service.
The 2022/23 share of operating spending (OPEX) on contractors and consultants as a percentage of spending on the Public Service workforce, is forecast to be between 12.8% and 13.1%, which is lower than for 2021/22.
We have provided a range to indicate the level of uncertainty around the forecast values that are used to calculate the share. The forecast for the OPEX share is based on the latest contractor and consultant forecasts from agencies. Forecast average salaries combined with agency FTE forecasts are used to estimate Public Service workforce expenditure.
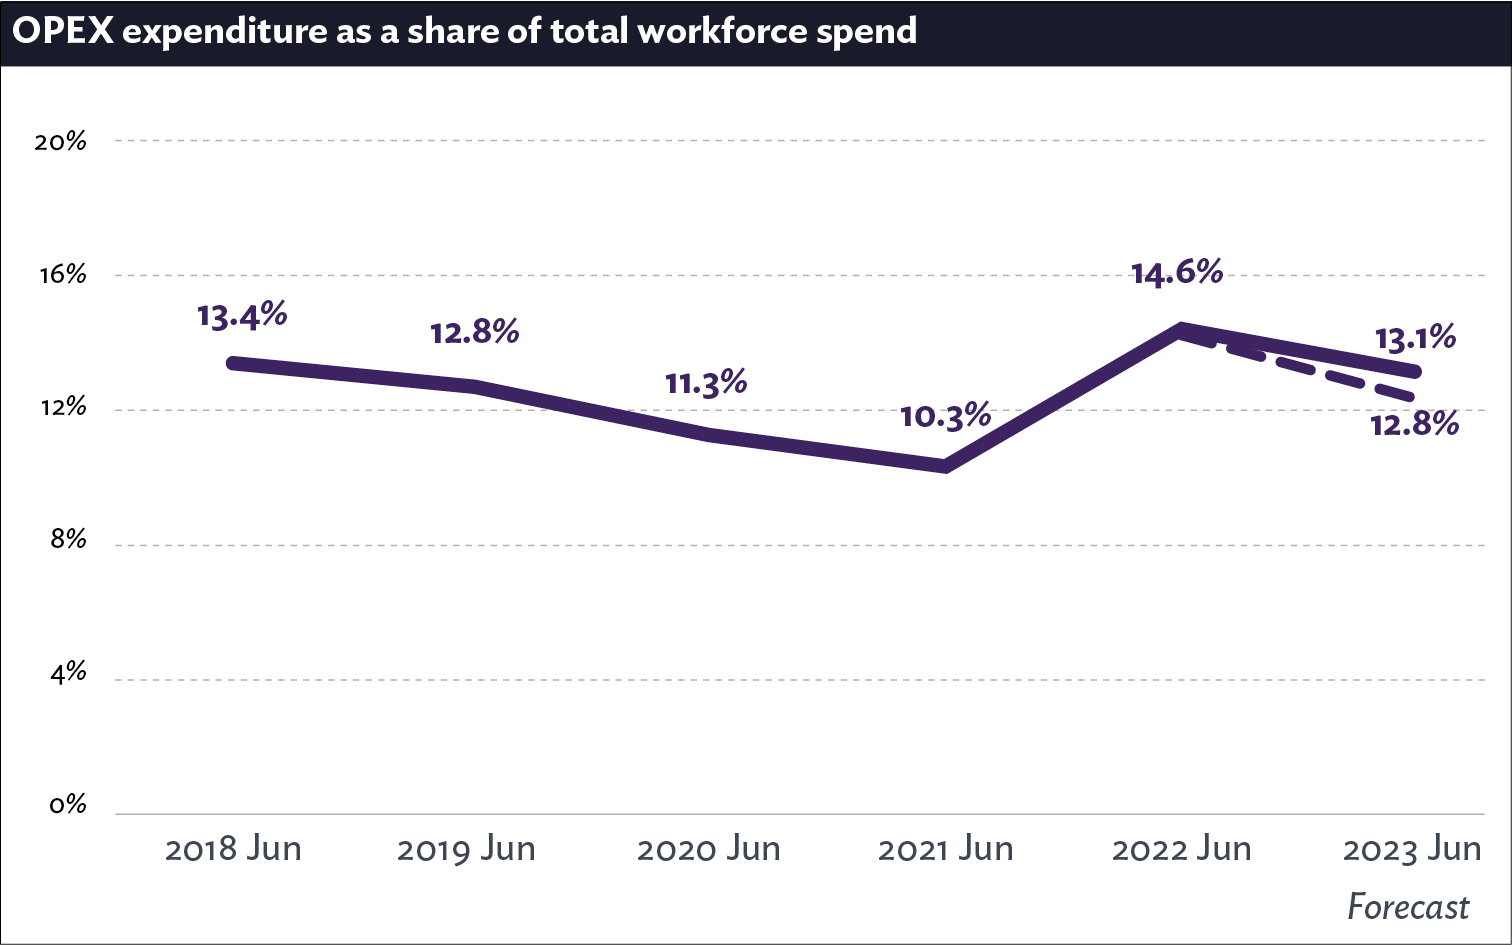
Alt = ”Line chart showing how the OPEX expenditure as a share of total workforce spend has changed since 2018 where the latest share has declined since last year.”
Agency results
|
Agency |
Full-time equivalent employees as at 31 Mar 2023 |
Operational expenditure on contractors and consultants in the 9 months to 31 Mar 2023 |
Capital expenditure on contractors and consultants in the 9 months to 31 Mar 2023 |
Total expenditure on contractors and consultants in the 9 months to 31 Mar 2023 |
|---|---|---|---|---|
|
Department of Corrections |
9,657 |
$25.5M |
$12.0M |
$37.5M |
|
Ministry of Social Development |
9,104 |
$82.3M |
$25.7M |
$107.9M |
|
Ministry of Business, Innovation and Employment |
6,123 |
$62.7M |
$11.4M |
$74.1M |
|
Oranga Tamariki-Ministry for Children |
4,609 |
$17.2M |
$4.9M |
$22.1M |
|
Ministry of Justice |
4,432 |
$19.5M |
$6.0M |
$25.5M |
|
Ministry of Education* |
4,329 |
$89.0M |
$98.3M |
$187.3M |
|
Inland Revenue Department |
3,971 |
$31.1M |
$0.8M |
$31.9M |
|
Ministry for Primary Industries |
3,733 |
$39.5M |
$2.7M |
$42.2M |
|
Department of Internal Affairs |
2,706 |
$57.5M |
$28.8M |
$86.3M |
|
Department of Conservation |
2,606 |
$16.8M |
$2.6M |
$19.4M |
|
Statistics New Zealand |
1,698 |
$16.4M |
$1.9M |
$18.3M |
|
New Zealand Customs Service |
1,345 |
$16.2M |
$14.2M |
$30.4M |
|
Ministry of Foreign Affairs and Trade |
1,168 |
$21.0M |
$0.0M |
$21.0M |
|
Ministry for the Environment |
986 |
$26.4M |
$0.0M |
$26.4M |
|
Land Information New Zealand |
792 |
$7.1M |
$15.4M |
$22.5M |
|
Ministry of Health |
725 |
$31.4M |
$0.1M |
$31.5M |
|
The Treasury |
604 |
$11.1M |
$3.6M |
$14.7M |
|
Government Communications Security Bureau |
541 |
|
|
|
|
Ministry of Māori Development-Te Puni Kōkiri |
424 |
$8.1M |
$0.0M |
$8.1M |
|
New Zealand Security Intelligence Service |
406 |
|
|
|
|
Ministry of Housing and Urban Development |
373 |
$16.0M |
$0.0M |
$16.0M |
|
Department of the Prime Minister and Cabinet |
257 |
$2.4M |
$0.0M |
$2.4M |
|
Ministry of Transport |
246 |
$17.4M |
$0.0M |
$17.4M |
|
Education Review Office |
220 |
$1.2M |
$0.0M |
$1.2M |
|
Crown Law Office |
210 |
$2.4M |
$0.0M |
$2.4M |
|
Public Service Commission |
198 |
$3.1M |
$0.4M |
$3.5M |
|
Office for Māori Crown Relations-Te Arawhiti |
187 |
$8.7M |
$0.0M |
$8.7M |
|
Ministry of Defence |
182 |
$2.7M |
$3.3M |
$6.0M |
|
Ministry for Culture and Heritage |
182 |
$7.4M |
$0.0M |
$7.4M |
|
Ministry of Disabled People |
162 |
$3.1M |
$0.0M |
$3.1M |
|
National Emergency Management Agency |
156 |
$1.0M |
$0.0M |
$1.0M |
|
Ministry for Pacific Peoples |
136 |
$1.9M |
$0.0M |
$1.9M |
|
Serious Fraud Office |
78 |
$0.7M |
$0.0M |
$0.7M |
|
Cancer Control Agency |
55 |
$0.7M |
$0.0M |
$0.7M |
|
Ministry for Women |
42 |
$0.9M |
$0.0M |
$0.9M |
|
Social Wellbeing Agency |
35 |
$0.5M |
$0.0M |
$0.5M |
|
Ministry for Ethnic Communities** |
|
$0.5M |
$0.0M |
$0.5M |
|
Grand Total - Public Service |
62,710 |
$649.1M |
$232.2M |
$881.2M |
* The information from the Ministry of Education for YTD Q3 2023 CAPEX has been imputed from their full year forecast.
** 2023 Ministry for Ethnic Communities FTEs included in Department of Internal Affairs results.