-
Section 01
Workforce Data — Senior leadership 2021
-
Section 02
Workforce Data — Remuneration/pay 2021
-
Section 03
Workforce Data — Māori Crown 2021
-
Section 04
Workforce Data — Public sector composition 2021
-
Section 05
Workforce Data — Diversity and inclusion 2021
-
5.1
Workforce Data — Ethnicity in the Public Service 2021
-
5.2
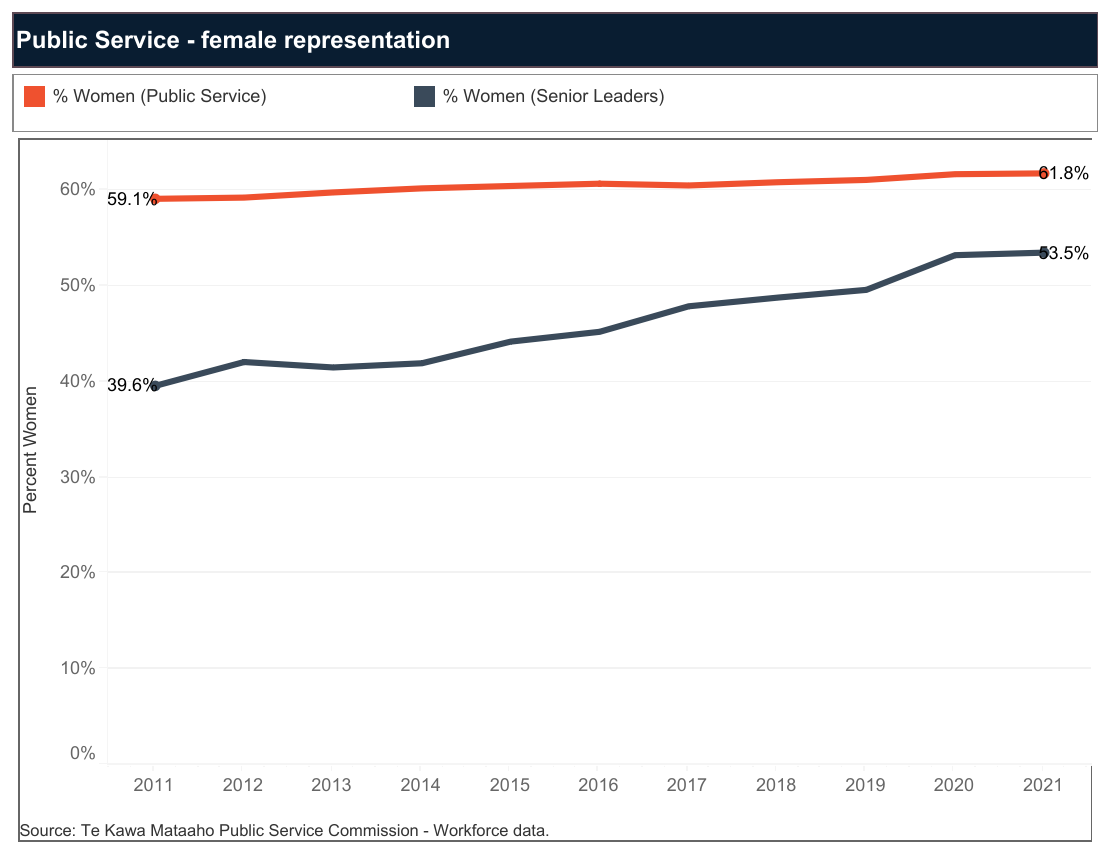
Workforce Data — Gender representation in the Public Service 2021
-
5.3
Workforce Data — Rainbow 2021
-
5.4
Workforce Data — Disability 2021
-
5.5
Workforce Data — Age profile 2021
-
5.6
Workforce Data — Religion 2021
-
5.7
Workforce Data — Inclusion 2021
-
5.1
-
Section 06
Workforce Data — Working in the Public service 2021
-
Section 07
Guidance: Data drilldown and technical guidance 2021
The data we collect provides information about gender across all Public Service staff and gender in senior leadership.
Gender across all staff
Women make up 61.8% of the Public Service workforce, while 37.9% are men. Information from the Public Service Census shows that those of another gender or multiple genders make up 0.5% of the Public Service workforce — a greater proportion than previously shown in Workforce Data.
Female representation is at the highest level since first measured in 2000 (56.2%). This compares with 50.7% in the New Zealand working-age population in the year ending June 2021 (from Stats NZ’s Household Labour Force Survey). The type of work in the Public Service may partly explain this high representation, as many Public Service occupations such as ‘social workers’, ‘case workers’ and ‘clerical and administration workers’ also have a high representation of women in the wider labour market.
Gender in senior leadership
Female representation at the senior leadership level has increased strongly over the past decade but remains below the proportion of women in the Public Service. As at 30 June 2021, the percentage of women in the top 3 tiers of senior management was 53.5% (up from 39.8% in 2010), while male representation is 46.3%.