-
Section 01
Workforce Data — Senior leadership 2021
-
Section 02
Workforce Data — Remuneration/pay 2021
-
Section 03
Workforce Data — Māori Crown 2021
-
Section 04
Workforce Data — Public sector composition 2021
-
Section 05
Workforce Data — Diversity and inclusion 2021
-
5.1
Workforce Data — Ethnicity in the Public Service 2021
-
5.2
Workforce Data — Gender representation in the Public Service 2021
-
5.3
Workforce Data — Rainbow 2021
-
5.4
Workforce Data — Disability 2021
-
5.5
Workforce Data — Age profile 2021
-
5.6
Workforce Data — Religion 2021
-
5.7
Workforce Data — Inclusion 2021
-
5.1
-
Section 06
Workforce Data — Working in the Public service 2021
-
Section 07
Guidance: Data drilldown and technical guidance 2021
The data we collect shows us wage growth by sector and provides information on the base salaries of staff in the Public Service.
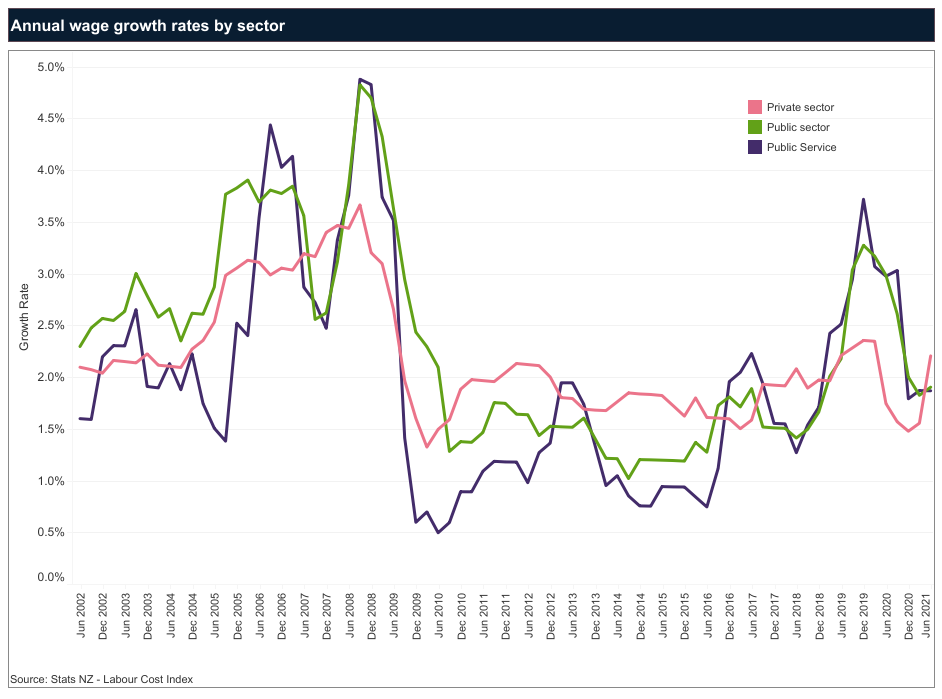
Wage growth by sector
On 28 April 2020, the then State Services Commissioner sent a letter to chief executives in the public sector to outline expectations for pay restraint in their organisations. The impact of decisions resulting from this guidance was seen in low Public Service wage growth in the December 2020 quarter. Further pay guidance, issued May 2021, has not yet been reflected in the Labour Cost Index (LCI).
Quarterly results from the June 2021 LCI1 show that salary and wage (including overtime) rates increased by 0.3% in the public sector in the June 2021 quarter (no change from the March 2021 quarter), and by 0.9% in the private sector (up from 0.4% in the March quarter). Within the public sector, the quarterly increase in the Public Service was 0.1% (down from 0.4% in the March quarter).
For the year to June 2021, the annual wage rate increase was 1.9% for the public sector and 2.2% for the private sector. The overall rate was 2.1% for all sectors. Inflation, as measured by the Consumer Price Index (CPI), increased by 3.3% for the year to June 2021. In the public sector, annual wage growth has fallen steadily since a high of 3.3% in December 2019. Within the public sector, annual wage movement to June 2021 in sub-sectors varied:
- Public Service (up 1.9%)
- health sector (up 1.4%)
- education sector (up 3.2%)
- local government (up 1.1%).
Since March 2010, private and public sector wages have displayed similar growth, with private sector growth being more even over the period and public sector showing stronger growth in recent quarters. Public sector wages grew by 1.7% per year over this period, and within it the Public Service at 1.5% per year, compared to the private sector of 1.8% per year.
The chart on the second tab of the visualisation above, shows the LCI trend in salary and wage movements of selected sectors since March 2010, on a quarterly cumulative basis. Since March 2010, private sector wage growth outstripped public sector wage growth until 2018, when public sector wages caught up, driven by significant increases in Health and Education. Between March 2010 and 30 June 2021 public sector wages had increased by 20.6% compared with 23.7% in the private sector. The CPI increased by 18.6% over the same period (excluding the effect of the GST increase on 1 October 2010 from 12.5% to 15%). Within the public sector, Public Service wages increased by 19.1%, compared with:
- 4% in the education sector
- 4% in the health sector
- 23% in local government.
1 Stats NZ’s LCI is an official measure of wage inflation. It measures changes in salary and wage rates that employers pay for the same job done at the same standard. The LCI doesn’t reflect compositional change in the workforce, service increments, merit promotions and increases relating to performance.
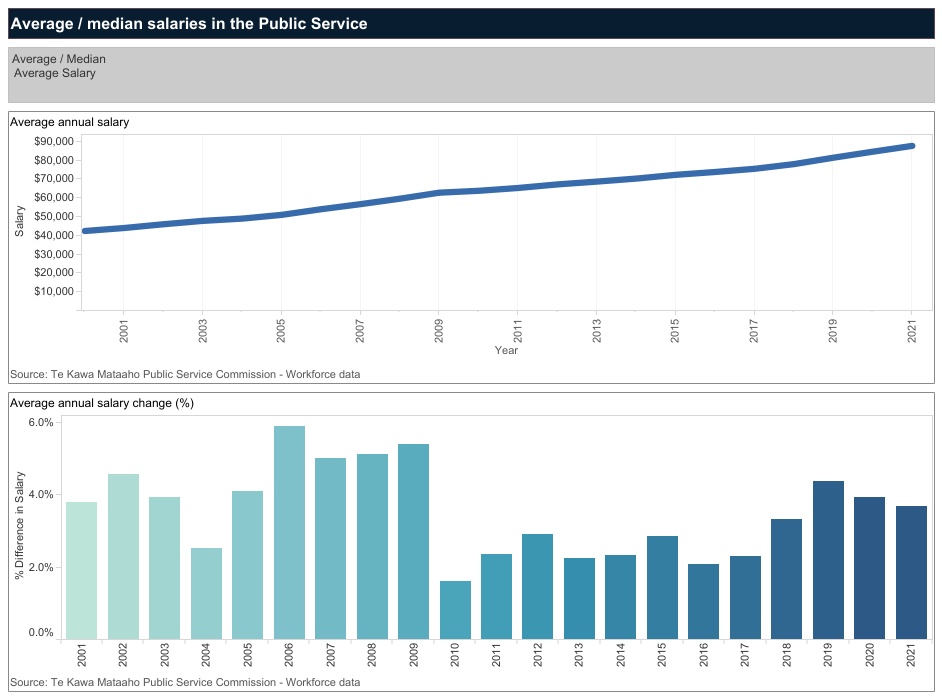
Annual salary in the Public Service
The collection of Public Service workforce data provides information on the base salaries of staff in the Public Service as at 30 June each year. In 2021, the average (mean) annual salary was $87,600, an increase of 3.7% from the previous year. Private sector average earnings increased at a higher rate (4.4%) over the same period — calculated using average total hourly earnings for the private sector from Stats NZ’s Quarterly Employment Survey.
Workforce Data salary movement is affected by:
- changes in the occupational composition of the workforce
- movement in staff pay
- service increments
- merit promotions
- performance-related increases
- salary differences between new and departing staff.
This salary movement is different to the LCI measures discussed in ‘Wage growth by sector’ — LCI is a more refined measure of real wage movement.
The trend since 2000 is shown on the chart in first tab of the visualisation below. Since the global financial crisis in 2008/09, Public Service annual salary growth rate has averaged 2.8% over the last 12 years (2010–2021), compared with the average growth rate of 4.5% in the previous 9 years (2001–2009).
Wage trends Average and Median Salary 2021
Median salaries measure the mid-point of the salary distribution (half of the employees are below or above this salary level). It’s less affected than average salaries by a small number of employees with very high salaries. The median salary for Public Service employees was $76,600. The annual growth of 5.5% was higher than for average salaries. This means that salaries generally increased more in the middle of the salary distribution than they did for those near the top (for example, the annual increase in salaries at the 95th percentile was 1.5%). The increase for the lowest paid was generally higher (for example, the annual increase in salaries at the 5th percentile was 6.6%).
Although not a measure of wage growth directly, the composition of the Public Service by salary range over time is an indication of how public servants’ wages are changing. In 2021, the number of public servants who earn less than $60,000 fell 19.2% (2,803 FTE) to 11,780 FTE. Staff earning less than $60,000 now comprise 19.3% of the public sector workforce, down from 25.5% in 2020.
In the year to June 2021, the increase in average salaries for Managers was 0.6% compared with 4.3% for staff in non-managerial occupations. Average salaries increased 5.0% for Social, Health and Education Workers, 4.4% for Contact Centre Workers, 3.4% for Clerical and Administrative Workers, 3.1% for Inspectors & Regulatory Officers, 1.7% for Policy Analysts, 1.5% for Information Professionals, and 1.2% for ICT Professionals and Technicians.
Departments that have a higher proportion of staff in operational and service delivery jobs tend to have a lower average salary, for example:
- Ministry of Justice
- Department of Corrections
- Ministry of Social Development
- Department of Conservation
- New Zealand Customs Service.
In contrast, organisations with a larger proportion of staff in leadership, specialist professional and policy roles tend to have a higher average salary, for example:
- Pike River Recovery Agency
- Te Kawa Mataaho Public Service Commission
- Ministry of Defence
- Social Wellbeing Agency
- the Treasury
- Ministry of Housing and Urban Development.