At the start of each month, the research provider, Gravitas Limited, sent out 432 survey invitations[1]. This number increased towards the end of 2019. The annual information included in the report draws on the experiences of 2,391 New Zealanders who completed Kiwis Count between January 2018 and December 2018.
Background
In 2007, for the first time, SSC asked a sample of New Zealanders about their experiences and views of public services. Known as the Kiwis Count survey, this provided rich information on how New Zealand’s public services were performing in the eyes of the people who use them. The survey ran for a second time in 2009. These first two surveys were point-in-time surveys.
In 2012 the survey moved to a continuous collection methodology. This is sixth report of annual results from the Kiwis Count survey since the survey became continuous in 2012.
Based on the methodology of a Canadian government survey called Citizens First, Kiwis Count measures satisfaction in public services. Public services means all services provided by government and includes central and local government services, tertiary institutions, schools and hospitals. Kiwis Count is an integral part of the New Zealanders’ Experience Research Programme (NZE), an SSC research initiative begun in 2007 and designed to find out how New Zealanders experience public services and to develop tools through which services can improve. The other two parts of NZE, designed to work together and complement and enhance each other are work on the drivers of satisfaction and the Common Measurements Tool.
New Zealanders’ Experience Research Programme
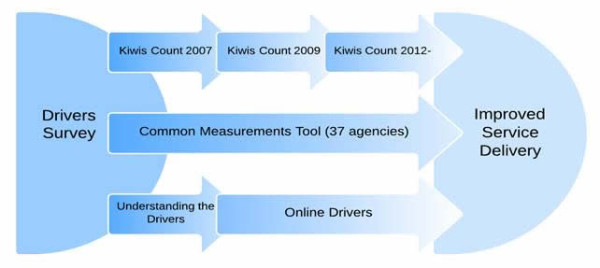
The drivers of satisfaction
The Drivers Survey[2], published in July 2007, identified the key factors (or drivers) that have the greatest influence on New Zealanders’ satisfaction with, and trust in, public services. The most effective way to improve satisfaction with public services is for agencies to focus on these key drivers. Kiwis Count has measured the drivers of satisfaction since it began in 2007 and, since 2012 Kiwis Count has measured the drivers by channel.
Questionnaire content
The Kiwis Count survey is modular. At the heart of the survey are questions about the public services that New Zealanders use most frequently. These core questions have been fixed since 2012, with new questions added only as required to reflect actual changes in services.
The modular part of the questionnaire is designed to change as required to focus on service delivery priorities:
- In the 2012 calendar year the survey included a module of questions on channel use and preferences. This repeated a module of questions which was included in the 2009 survey.
- Starting in 2013 a module of questions about the ease of transacting with government in the digital environment replaced the previous module. The new module, developed with the team responsible for Result 10[3] of the Better Public Services programme, will be one of a suite of measures used to report on the progress of Result 10.
- For the first half of 2014, a new module of questions was included. It was about parent/primary caregiver’ satisfaction with education services.
- In the second half of 2014, at the request of the Result 10 team, new questions were added:
- To the Government and the digital environment module.
- To the main body of the survey, at A10, about experiencing public services.
- In 2015, new questions were added, at A13, about the privacy of personal information for the Office of the Chief Privacy Officer.
In 2016 a comprehensive review of the questionnaire was undertaken to ensure its continued usefulness. This new questionnaire has been used from the beginning of 2017. The new questionnaire can be downloaded or viewed at https://www.publicservice.govt.nz/kiwis-count.
Encouraging online participation
Seventy one percent of respondents chose to complete the survey online in the year to December 2019, up from 65% in 2017. Online completion rates have been growing since 2015. This compares to online rates of 17% in 2009 and 8% in 2007.
Sample size
|
Collection Year |
Numbers of New Zealanders who answered the survey |
% online |
% hardcopy/ office |
|
2007 |
3362 |
- |
- |
|
2009 |
3724 |
- |
- |
|
2012 |
2226 |
58% |
42% |
|
2013 |
2524 |
57% |
43% |
|
2014 |
6050 |
57% |
43% |
|
2015 |
2232 |
58% |
42% |
|
2016 |
2137 |
60% |
40% |
|
2017 |
1935 |
65% |
35% |
|
2018 |
1901 |
70% |
30% |
|
2019 |
2391 |
71% |
29% |
A total of 28,482 New Zealanders have completed the survey since it began.
Service quality scores
The Kiwis Count survey asks New Zealanders to rate services or express opinions using a scale from 1 to 5. To enable comparisons between Kiwis Count and Citizens First to be made, we have adopted the Canadian approach of converting five point rating scales to service quality scores ranging from 0 to 100. The overall SQS is calculated by rescaling the result from each respondent’s five-point scale (1,2,3,4,5) to a 101 point scale (0,25,50,75,100) then calculating an average of these scores from all the services used.
The overall average uses all service experiences, so a respondent who has used 10 services contributes 10 observations to the overall score and a respondent who has used one service contributes one observation to the overall score.
Example: the service quality question
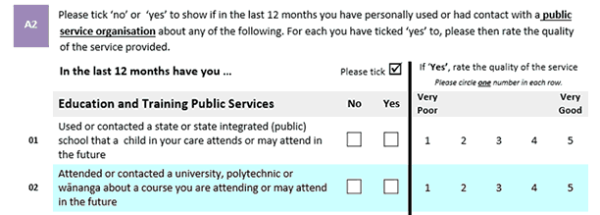
[1] “People have easy access to Public Services, which are designed around them, when they need them.”
[2]The full report on the Drivers Survey can be found at https://www.publicservice.govt.nz/drivers-report and the summary report can be found at https://www.publicservice.govt.nz/understanding-drivers-report
[3]More survey invitations were sent out in the first half of 2014 to ensure a sufficient sample of parent / primary caregivers answered the survey for a one-off module for the Ministry of Education.