-
Section 01
Workforce Data — Senior leadership 2021
-
Section 02
Workforce Data — Remuneration/pay 2021
-
Section 03
Workforce Data — Māori Crown 2021
-
Section 04
Workforce Data — Public sector composition 2021
-
Section 05
Workforce Data — Diversity and inclusion 2021
-
5.1
Workforce Data — Ethnicity in the Public Service 2021
-
5.2
Workforce Data — Gender representation in the Public Service 2021
-
5.3
Workforce Data — Rainbow 2021
-
5.4
Workforce Data — Disability 2021
-
5.5
Workforce Data — Age profile 2021
-
5.6
Workforce Data — Religion 2021
-
5.7
Workforce Data — Inclusion 2021
-
5.1
-
Section 06
Workforce Data — Working in the Public service 2021
-
Section 07
Guidance: Data drilldown and technical guidance 2021
The data we collect gives us information about the ethnic diversity across the Public Service, Māori representation and how many public servants are born overseas.
Ethnic diversity across all staff
There is increasing ethnic diversity in the Public Service. Although Europeans still made up the highest proportion (66.1%) in 2021, this has decreased steadily over the past 20 years. Both Māori (16.4%) and Pacific (10.2%) representation in the Public Service workforce increased over the past year and continue at high levels compared to the overall New Zealand working-age population (14.5% and 6.8% respectively in the year to June 2021).
There was a further increase in the representation of Asian staff (12.5%), following increases in each of the last 9 years, although this still lags behind Asian representation in the New Zealand working-age population (15.4%). The relatively large increase in the Public Service workforce over the past year has contributed to this increase in Asian representation. New recruits tend to be more ethnically diverse than the existing workforce, and the share of Asian staff recruited into Public Service departments in the year ending 30 June 2021 (14.9%) was more than for the existing workforce.
Representation of Middle Eastern, Latin American and African (MELAA) employees in the Public Service (1.8%), has been increasing steadily over the past 5 years, and is slightly higher than that in the New Zealand working-age population (1.3%).
The increase in Asian and Pacific staff is particularly pronounced in Auckland where they comprised 24.9% and 23.5% of Auckland Public Service employees in 2021 respectively.
Detailed ethnicity data collected through Te Taunaki Public Service Census 2021 revealed the full range of ethnic diversity seen in the Public Service for the first time, with 165 different ethnic groupings reported. The benefit of Te Taunaki data is that it enables a view into smaller groups. For example:
- 5.2% of respondents identified as Indian
- 5.1% as British or Irish
- 4.5% as Samoan
- 3.3% as Chinese
- 0.6% as African
- 0.5% as Latin American
- 0.5% as Middle Eastern.
Further breakdowns are possible for all groupings. For example, British and Irish can be broken down into Scottish, Welsh, Irish, English, Channel Islander, and so on.
Ethnic diversity by occupation
There are ethnic differences in terms of Public Service occupations. European staff are over-represented as ‘managers’ and ‘policy analysts’. Māori and Pacific staff are well represented as ‘inspectors and regulatory officers’, ‘social, health and education workers’ and as ‘contact centre workers’ but less so in other professions. Asian staff are also well represented as ‘contact centre workers’ but represented most highly as ‘ICT professionals and technicians’.
Note that there has been a focus on improving the quality of Public Service workforce ethnicity information in recent years. We released a Standard for Workforce Information that expects departments to follow the Stats NZ statistical standard for ethnicity when collecting ethnicity information from their staff. There has also been an increase in the share of Public Service employees who have declared their ethnicity in recent years, up from 86.1% in 2014 to more than 90% in each of the last 4 years. Some of the changes in ethnic diversity over time could be due to these increases in data quality, rather than real world changes.
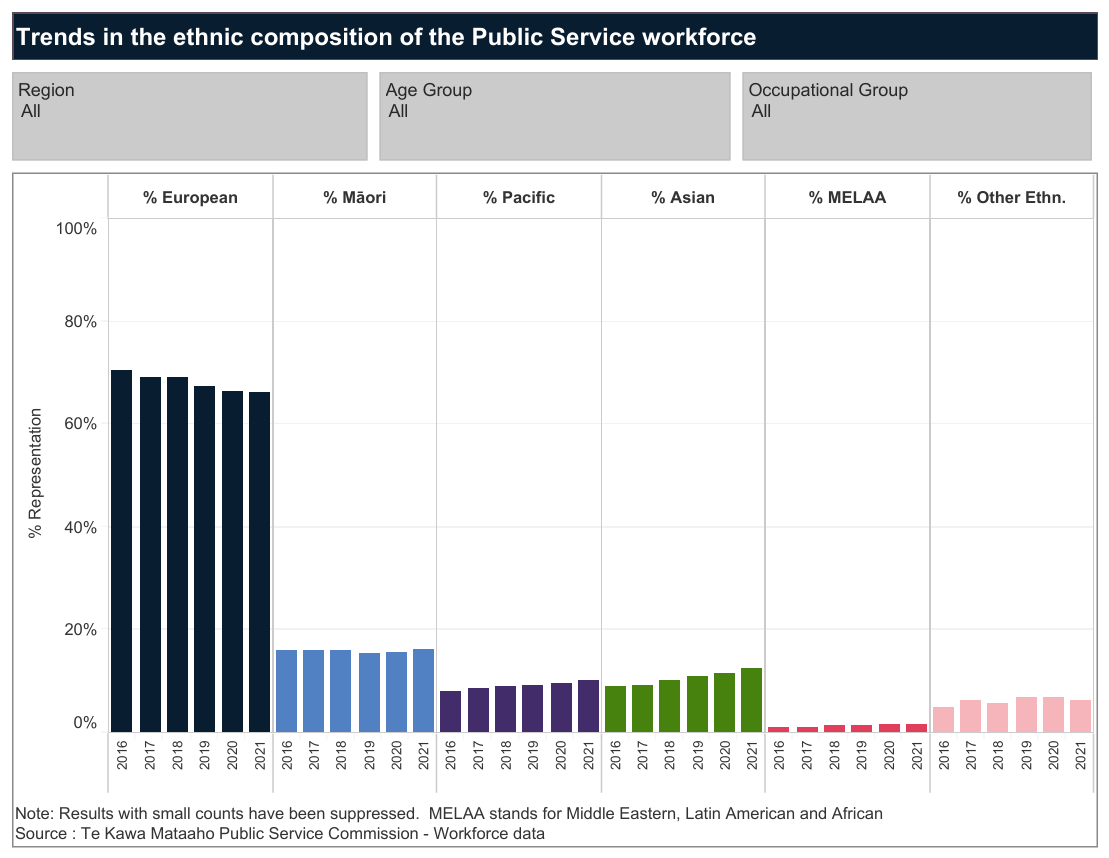
Trends in the ethnic composition of the Public Service workforce 2021
Māori representation and iwi affiliation
Māori make up 16.4% of the Public Service workforce as of 30 June 2021. Data from Te Taunaki indicates that Māori public servants are affiliated to over 120 different iwi, with most Māori having whakapapa to multiple iwi.
Iwi information was collected using the same process developed by the Data Iwi Leaders Group (a subgroup of the National Iwi Leaders Forum) and Stats NZ to address the gaps in iwi affiliation data in the 2018 Census. This means Public Service iwi affiliations can be grouped and compared with figures for the New Zealand population as shown in the table below.
|
Iwi Grouping |
Public Service: % of 7,230 people of Māori descent |
New Zealand population: % of 869,850 people of Māori descent |
|
Te Hiku |
7.8% |
5.4% |
|
Hauraki |
2.9% |
2.3% |
|
Ngāi Tahu Whānui |
9.2% |
8.7% |
|
Ngāti Kahungunu |
12.2% |
9.5% |
|
Ngāti Raukawa |
6.1% |
4.3% |
|
Ngāti Tama |
0.3% |
0.3% |
|
Te Arawa |
8.8% |
6.9% |
|
Te Atiawa |
5.2% |
3.4% |
|
Tūranganui a Kiwa |
2.6% |
1.7% |
|
Waikato-Tainui |
10.2% |
9.7% |
|
Ngāti Toarangatira |
2.0% |
0.8% |
|
Rangitāne |
1.4% |
0.9% |
|
Ngāpuhi nui tonu |
16.2% |
19.6% |
|
Mōkai Pātea |
0.4% |
0.2% |
|
Other |
56.3% |
41.4% |
|
Ngā Hotahota o te Whitau |
3.5% |
15.7% |
The table shows the representation of iwi in the Public Service is broadly similar to the wider population. The variation that is present may in part be explained by the regional distribution of the Public Service, with the largest proportion of the workforce (44.9%) located in the Wellington region. Other regions have 55.1% of the workforce, led by Auckland (20.4%), Canterbury (9.1%) and Waikato (6.7%).
New Zealand public servants born overseas and years since arrival
Te Taunaki asked how long staff had been in New Zealand — of those who responded, 71% were born in New Zealand, with a further 26% having been in New Zealand for at least 5 years (of these, 12% had been here 20 years or more). Only 3.3% were relatively recent migrants, having spent less than five years in New Zealand.
These responses are consistent with previously obtained Stats NZ Census data, requested to get a better picture of migrant flow into the Public Service. In 2018, around 28% of Public Service and Administration employees in 2018 were born overseas, up from around 22% in 2006. This compared to around 31% of all employed New Zealanders in 2018, 32% of those working in the private sector and nearly 40% of those working in central government health and tertiary education. Around 43% of Public Service and Administration employees in Auckland were born overseas.
The Stats NZ data showed that migrants who became New Zealand Public Service employees had come from over 50 countries. As of 2018, Commonwealth countries provided the largest proportion of overseas-born public servants, led by the United Kingdom, India, South Africa and Australia, followed by Fiji, the Philippines and Samoa. By comparison, in the private sector a higher proportion of overseas-born employees had migrated from Asian countries such as India and China.
Note that some 2018 data for state owned enterprises was included in the private sector results through the Stats NZ Census coding process.
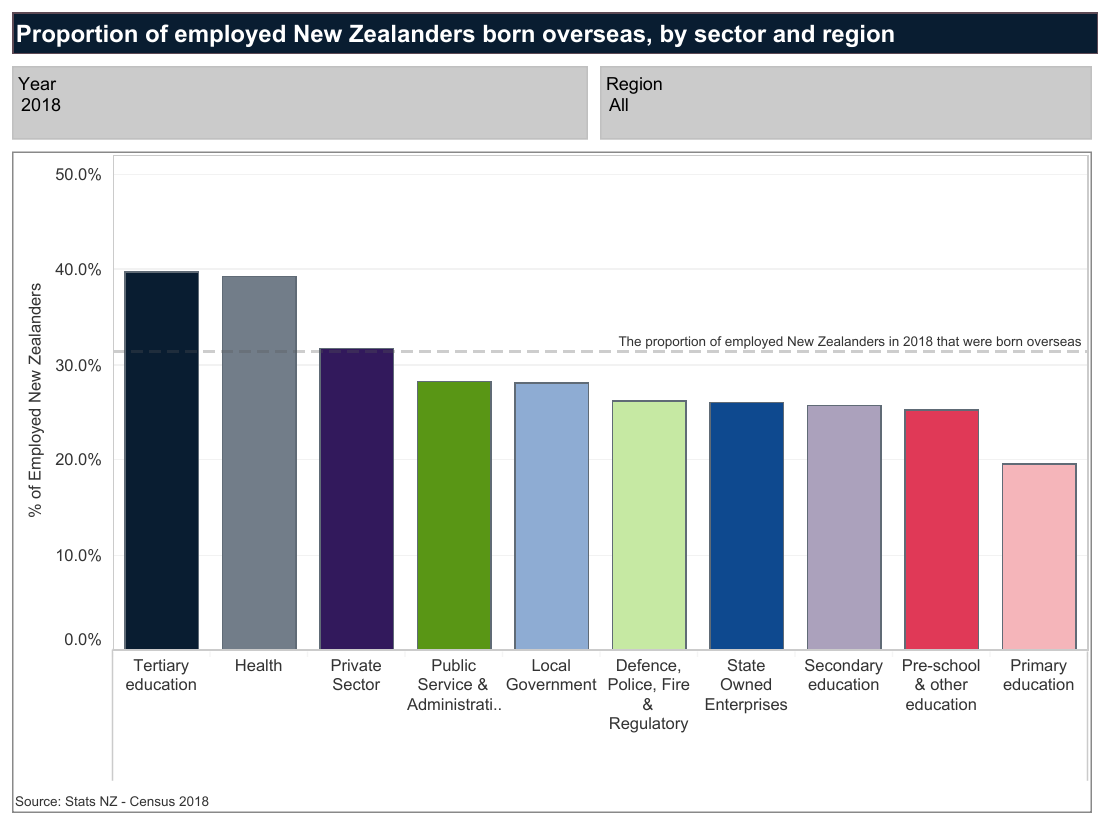
Proportion of employed New Zealanders born overseas, by sector and region 2021
Ethnic diversity in senior leadership
The table below shows that European staff continue to be over-represented in each of the top 3 tiers of Public Service leadership, when compared with either the Public Service workforce as a whole or the wider population. Māori representation in senior leadership is close to those wider measures, while Pacific and Asian leaders continue to increase slowly, but remain under-represented. This will take time and deliberate effort to increase, as non-European ethnicities are also under-represented at lower levels of management.
Note: The data for the following table is correct as at 30 June 2021.
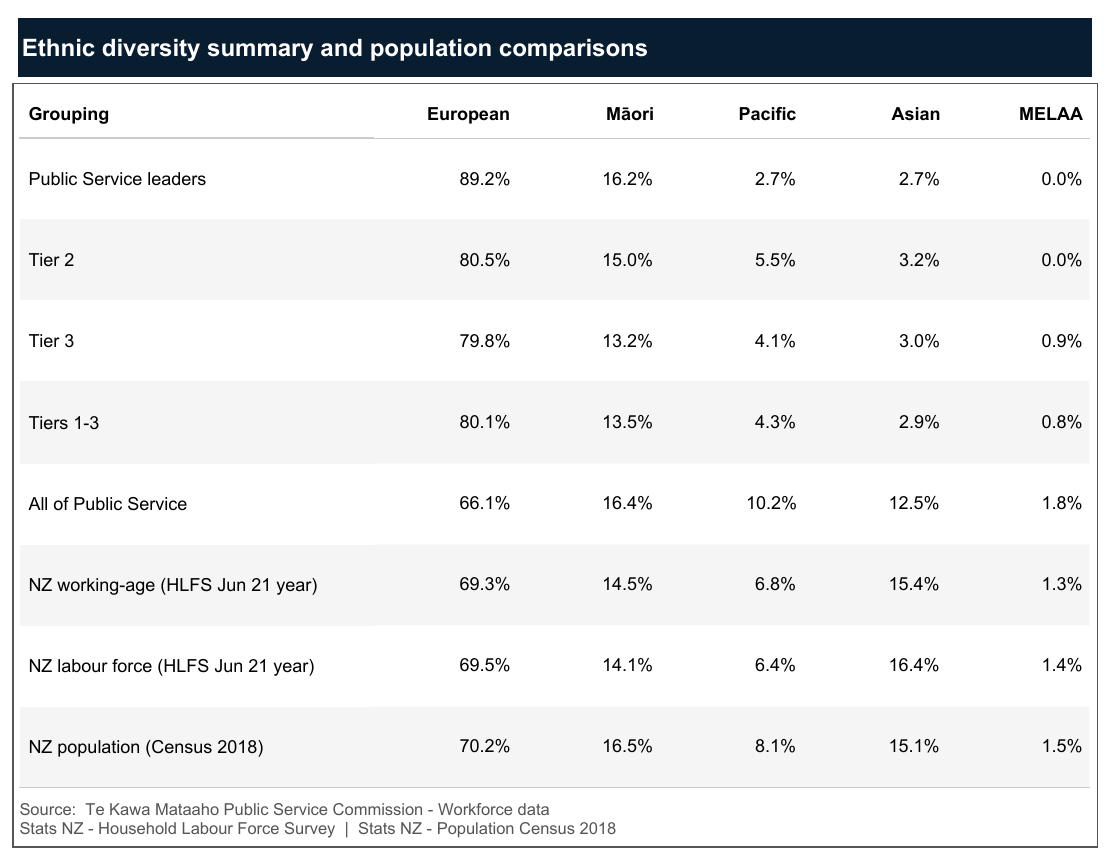
As of 30 June 2021, the 37 Public Service Leaders reported being 89.2% European, 16.2% Māori, 2.7% Pacific Peoples and 2.7% Asian (these add to more than 100% as it includes those with multiple ethnicities).