-
Section 01
Raraunga Ohumahi 2022 — Kaiārahi Matua Workforce data 2022 — Senior leadership
-
Section 02
Raraunga Ohumahi 2022 — Taiutu Workforce data 2022 — Remuneration/pay
-
Section 03
Raraunga Ohumahi 2022 — Māori Karauna Workforce data 2022 - Māori Crown
-
Section 04
Raraunga Ohumahi 2022 — Ta te rāngai tūmatanui hanga Workforce data 2022 — Public sector composition
-
Section 05
Raraunga Ohumahi — Te Kanorau me te Whakaurunga Workforce data 2022 — Diversity and inclusion
-
5.1
Raraunga Ohumahi — Te iwitanga i roto i te Ratonga Tūmatanui Workforce Data 2022 — Ethnicity in the Public Service
-
5.2
Raraunga Ohumahi — Te Ira Tangata i roto i Te Ratonga Tūmatanui Workforce Data 2022 — Gender representation in the Public Service
-
5.3
Raraunga Ohumahi 2022 — Āniwaniwa Workforce Data 2022 — Rainbow
-
5.4
Raraunga Ohumahi — Hunga whaikaha Workforce Data 2022 — Disability
-
5.5
Raraunga Ohumahi 2022 — Kāhua taipakeke Workforce Data 2022 — Age profile
-
5.6
Raraunga Ohumahi 2022 — Hāhi Workforce Data 2022 — Religion
-
5.7
Raraunga Ohumahi 2022 — Whakaurunga Workforce Data 2022 — Inclusion
-
5.1
-
Section 06
Raraunga Ohumahi 2022 — Te mahi i roto i te Rāngai Tūmatanui Workforce data 2022 - Working in the Public Service
-
6.1
Raraunga Ohumahi 2022 — Paearu mahi Workforce Data 2022 — Conditions of employment
-
6.2
Raraunga Ohumahi 2022 — Te hauora i roto i te mahi Workforce Data 2022 — Wellbeing at work
-
6.3
Raraunga Ohumahi 2022 — Te whakataurite oranga me te mahi Workforce Data 2022 — Balancing life and work
-
6.4
Raraunga Ohumahi 2022 — Te nekeneke Workforce Data 2022 — Mobility
-
6.5
Raraunga Ohumahi 2022 — Wairua Whakarato Workforce Data 2022 — Spirit of Service
-
6.6
Raraunga Ohumahi 2022 — Te āheinga Workforce Data 2022 — Capability
-
6.1
-
Section 07
Data drilldowns and technical guidance 2022
Workforce Data tables and visualisations showing demographic summaries, workforce metrics and detailed workforce views and experience, as well as helpful definitions.
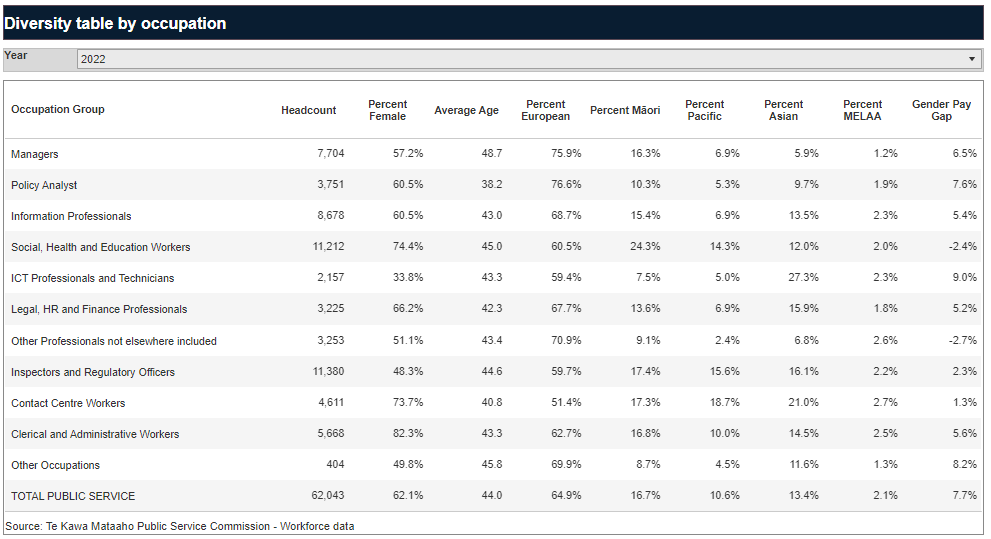
Demographic summary — Workforce Data from HR records
The following interactive tables show key demographic measures by department and occupational group.
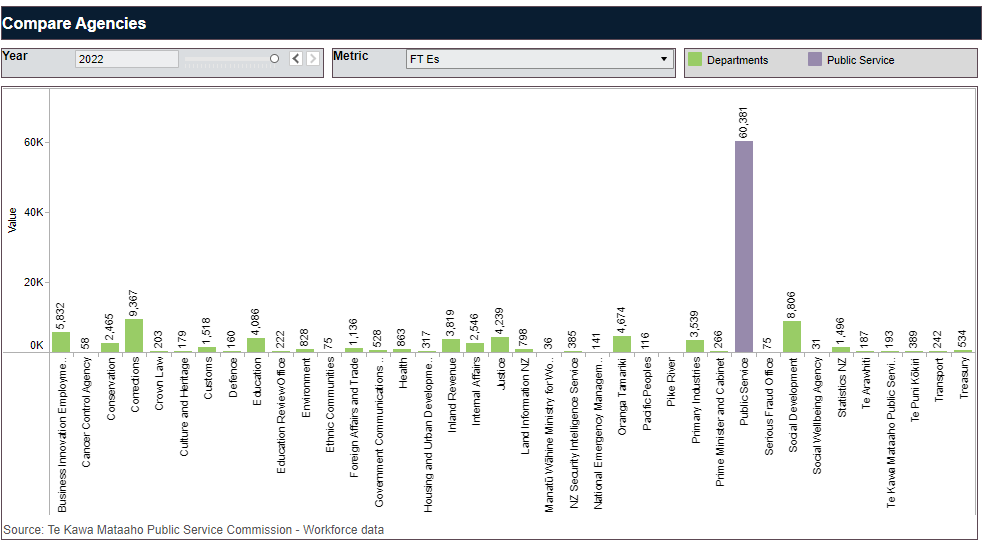
Detailed workforce metrics over time — Workforce Data from HR records
The following visualisation displays data by department and workforce metrics over time.
Detailed workforce views and experience — Te Taunaki Public Service Census
The following visualisation provides the views and experiences of Public Service staff by subject and demographic groups (captured via questions and agreement scales asked in Te Taunaki Public Service Census 2021).

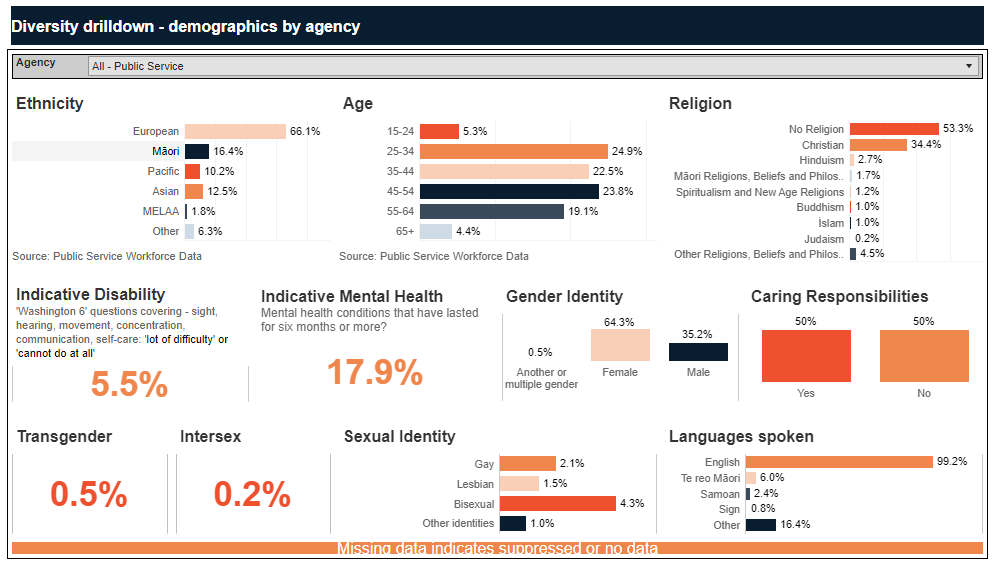
Diversity demographics summary — Te Taunaki Public Service Census
The following visualisation shows the diversity of Public Service staff by department (as captured in questions asked in Te Taunaki Public Service Census 2021).
Guidance: Information standards and guidance
Find information about contractor and consultant expenditure in Workforce Data — Workforce Size
Use of contractors and consultants starts to level off