-
Section 01
Raraunga Ohumahi 2022 — Kaiārahi Matua Workforce data 2022 — Senior leadership
-
Section 02
Raraunga Ohumahi 2022 — Taiutu Workforce data 2022 — Remuneration/pay
-
Section 03
Raraunga Ohumahi 2022 — Māori Karauna Workforce data 2022 - Māori Crown
-
Section 04
Raraunga Ohumahi 2022 — Ta te rāngai tūmatanui hanga Workforce data 2022 — Public sector composition
-
Section 05
Raraunga Ohumahi — Te Kanorau me te Whakaurunga Workforce data 2022 — Diversity and inclusion
-
5.1
Raraunga Ohumahi — Te iwitanga i roto i te Ratonga Tūmatanui Workforce Data 2022 — Ethnicity in the Public Service
-
5.2
Raraunga Ohumahi — Te Ira Tangata i roto i Te Ratonga Tūmatanui Workforce Data 2022 — Gender representation in the Public Service
-
5.3
Raraunga Ohumahi 2022 — Āniwaniwa Workforce Data 2022 — Rainbow
-
5.4
Raraunga Ohumahi — Hunga whaikaha Workforce Data 2022 — Disability
-
5.5
Raraunga Ohumahi 2022 — Kāhua taipakeke Workforce Data 2022 — Age profile
-
5.6
Raraunga Ohumahi 2022 — Hāhi Workforce Data 2022 — Religion
-
5.7
Raraunga Ohumahi 2022 — Whakaurunga Workforce Data 2022 — Inclusion
-
5.1
-
Section 06
Raraunga Ohumahi 2022 — Te mahi i roto i te Rāngai Tūmatanui Workforce data 2022 - Working in the Public Service
-
6.1
Raraunga Ohumahi 2022 — Paearu mahi Workforce Data 2022 — Conditions of employment
-
6.2
Raraunga Ohumahi 2022 — Te hauora i roto i te mahi Workforce Data 2022 — Wellbeing at work
-
6.3
Raraunga Ohumahi 2022 — Te whakataurite oranga me te mahi Workforce Data 2022 — Balancing life and work
-
6.4
Raraunga Ohumahi 2022 — Te nekeneke Workforce Data 2022 — Mobility
-
6.5
Raraunga Ohumahi 2022 — Wairua Whakarato Workforce Data 2022 — Spirit of Service
-
6.6
Raraunga Ohumahi 2022 — Te āheinga Workforce Data 2022 — Capability
-
6.1
-
Section 07
Data drilldowns and technical guidance 2022
The data we collect provides information about the composition of the wider public sector, the composition of the Public Service workforce, and how much was spent on contractors and consultants.
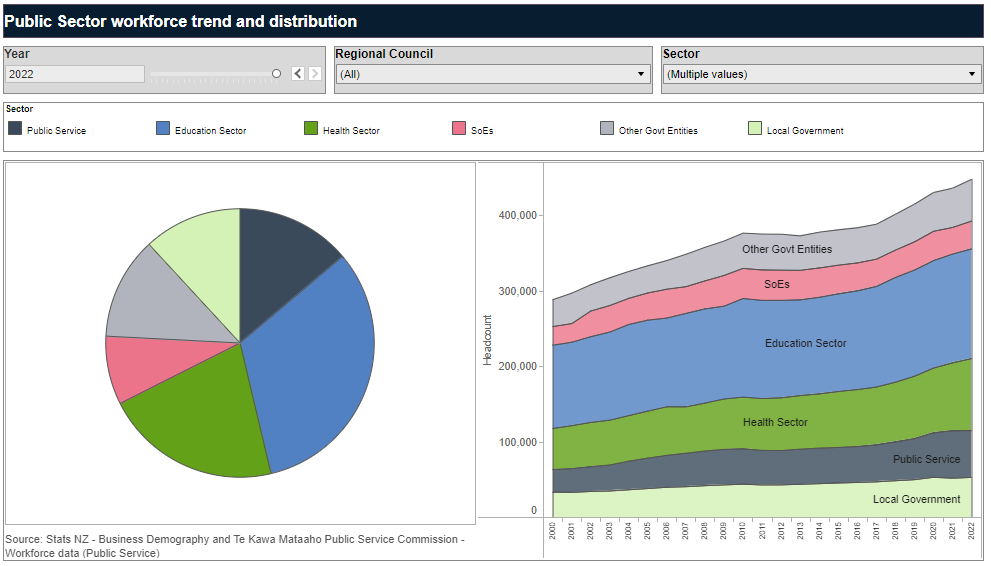
The composition of the wider public sector
The public sector employed around 448,200 people in 2022, 18.7% of New Zealand’s total workforce (2,393,400), as measured by Stats NZ’s Business Demography data. The majority (88%) work in central government (395,000) and 12% in local government (53,200).
The central government sector comprises all public sector employees, except those in local government. This includes the Public Service, health sector (including Health New Zealand employees), the education sector (including primary, area and secondary school staff), and Crown entities.
Over the last 5 years, the overall public sector workforce increased by 15.3% (with central government up 15.7% and local government up 12.5%). This compares with an 9.4% growth in the private sector over the same period.
The sector composition of workforce varies amongst the regions (see the interactive dashboard below).
Composition of the Public Service workforce
This section presents results on how the size and composition of the Public Service workforce have changed over time. The Public Service is a part of the wider public sector, representing departments and departmental agencies.
In addition to the annual 30 June public service workforce data collection, agencies are now reporting on the size of their workforce each quarter. The latest figures for the March 2023 quarter are available here: Public Service Workforce Composition - March 2023 quarter
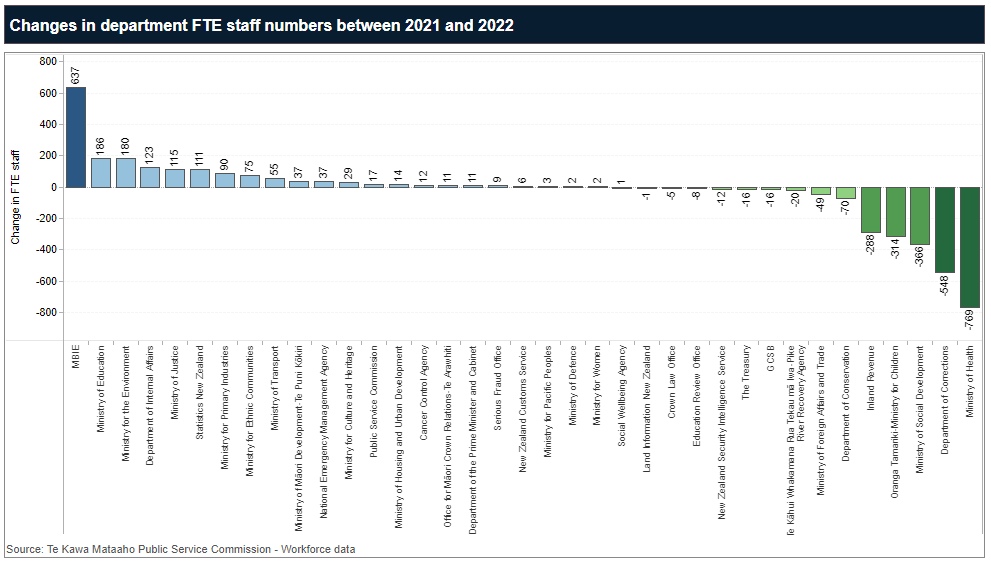
There were 60,381 full-time equivalent (FTE) staff at 30 June 2022. This is a decrease of 1.2% (or 715 FTEs) from 61,097 FTEs in 2021. It is the first decline in ten years.
The decrease in the size of the workforce in 2022 was driven by a number of factors. The largest change related to machinery of government changes arising from the Health Reforms. The Ministry of Health had 769 fewer FTEs than last year, rather than around 140 FTEs more, due to functions moving to the new health entities that will be outside the Public Service on 1 July. Without these machinery of government changes, the annual growth in the size of the Public Service workforce would have been around 0.3%, rather than a decrease of 1.2%.
This is slower than the recent growth in the Public Service workforce. For example, in the year to 30 June 2021 there was an increase of 6.9% (or 3,948 FTEs). Other agencies that contributing to this slowdown were:
- The Department of Corrections (down 548 FTEs), which faced recruitment difficulties due to the tight labour market conditions.
- The Ministry of Social Development (down 366 FTEs), which had a reduction in fixed-term staff associated with time-limited projects (such as COVID).
- Oranga Tamariki Ministry for Children (down 314 FTES), resulting from tight labour market conditions, strategic organisational change, and a reduction in fixed-term staff.
- Inland Revenue (down 288 FTEs), as it continues to right-size following implementation of its Business Transformation Programme.
The largest increases in FTEs occurred at:
- The Ministry for Business, Innovation and Employment (up 637 FTEs), to support reconnecting New Zealand to the world, and to deliver on Government priorities.
- The Ministry of Education (up 186 FTEs), to deliver on Government priorities to increase learning support specialists and frontline advisors (73 FTEs), improve schools’ property portfolio and digital environment (65 FTEs) and support the national curriculum refresh (35 FTEs).
- The Ministry of the Environment (up 180 FTEs), to deliver Government priority changes around resource management, freshwater, climate change, and waste.
Looking across all 37 Public Service departments and departmental agencies, 23 of them increased in size and 14 agencies reported a decrease.
Contractor and consultant expenditure
This section presents results on contractor and consultant expenditure in the Public Service and how it has changed over time.
In addition to the annual 30 June public service contractor and consultant data collection, agencies are now reporting on their expenditure on contractors and consultants each quarter. The latest figures for the March 2023 quarter are available here: Public Service Workforce Composition - March 2023 quarter
In 2021/22, Public Service organisations spent a total of $1,244.8 million on contractors and consultants. This was an increase of 32% on the 2020/21 spend of $million, with the increase mainly driven by:
- COVID-19, including the national vaccination rollout.
- Government priorities, especially big reform work programmes. These include transitioning to a new national health service (health reform), overhauling New Zealand’s building and land use planning system (RMA reforms), and improving the quality of our drinking water and the reliability of our stormwater and wastewater systems (Three Waters reform). There were also some costs associated with the Royal Commission into Abuse in Care.
- One-off IT improvement projects and upgrading systems for online access to government services, and migrating legacy systems to cloud-based, which are more secure, resilient and cost efficient in the long-term.
Other contributing factors to this year’s expenditure include restarting projects that were put on hold during the pandemic and the tight labour market, with the country’s borders not fully opening until the middle of this year.
Total expenditure comprises operational expenditure of $926.9 million (up 52% from $609.6 million in 2020/21) and capital expenditure of $317.9 million (down 4.1% from $331.5 million in 2020/21).
Operating expenditure on contractors and consultants was 14.6% of total Public Service workforce spend ($6,328.8 million), an increase from 10.4% in 2020/21, 11.3% in 2019/20, 12.8% in 2018/19 and 13.4% in 2017/18. This increase was due to contractor and consultant operating expenditure increasing for the reasons outlined above. This measure represents the balance between using external resources where appropriate and building capacity and capability in the Public Service.
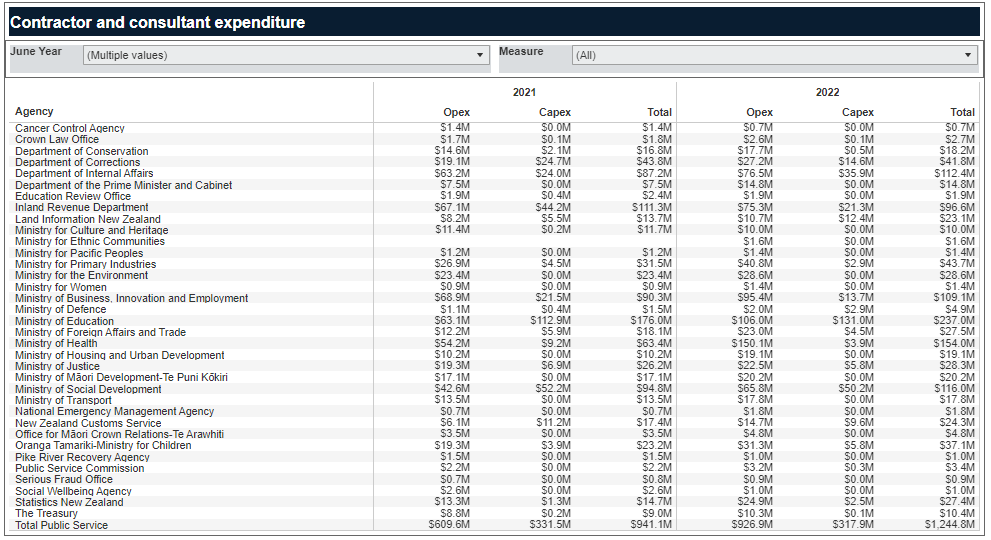
Note that some 2020/21 figures have been revised since they were first published. The reported total operating expenditure has changed from $603.4 million to $609.6 million and total capital expenditure has changed from $335.6 million to $331.5 million.
Public Service contractor and consultant data for the 2017/18 year was the first to be published using our new guidance on how to report contractor and consultant expenditure. Before the new guidance, there was inconsistency in how organisations reported this expenditure.
Contractors and Consultants Guidance
The focus is on operating expenditure, as the large one-off investments that capital expenditure typically represents are likely to have a different mix of public servants and contractors/consultants and the resulting expenditure is likely to be volatile over time due to the fixed-term nature of these projects.
Contractor and consultant expenditure definitions
Operating expenditure (OPEX) — this is the money spent for contractors and consultants that are not for the purpose of acquiring or developing assets.
Capital expenditure (CAPEX) — this is the money spent to acquire resources to develop assets, tangible and intangible, through procurement of contractors and consultants.
Total workforce spend — this is the sum of salary expenditure for permanent and fixed-term employees, and operational expenditure on contractors and consultants.
2020 Public Service Workforce Data released
Use of contractors and consultants starts to level off
The first release was for the 2017/2018 financial year and can be located here.