-
Section 01
Raraunga Ohumahi 2022 — Kaiārahi Matua Workforce data 2022 — Senior leadership
-
Section 02
Raraunga Ohumahi 2022 — Taiutu Workforce data 2022 — Remuneration/pay
-
Section 03
Raraunga Ohumahi 2022 — Māori Karauna Workforce data 2022 - Māori Crown
-
Section 04
Raraunga Ohumahi 2022 — Ta te rāngai tūmatanui hanga Workforce data 2022 — Public sector composition
-
Section 05
Raraunga Ohumahi — Te Kanorau me te Whakaurunga Workforce data 2022 — Diversity and inclusion
-
5.1
Raraunga Ohumahi — Te iwitanga i roto i te Ratonga Tūmatanui Workforce Data 2022 — Ethnicity in the Public Service
-
5.2
Raraunga Ohumahi — Te Ira Tangata i roto i Te Ratonga Tūmatanui Workforce Data 2022 — Gender representation in the Public Service
-
5.3
Raraunga Ohumahi 2022 — Āniwaniwa Workforce Data 2022 — Rainbow
-
5.4
Raraunga Ohumahi — Hunga whaikaha Workforce Data 2022 — Disability
-
5.5
Raraunga Ohumahi 2022 — Kāhua taipakeke Workforce Data 2022 — Age profile
-
5.6
Raraunga Ohumahi 2022 — Hāhi Workforce Data 2022 — Religion
-
5.7
Raraunga Ohumahi 2022 — Whakaurunga Workforce Data 2022 — Inclusion
-
5.1
-
Section 06
Raraunga Ohumahi 2022 — Te mahi i roto i te Rāngai Tūmatanui Workforce data 2022 - Working in the Public Service
-
6.1
Raraunga Ohumahi 2022 — Paearu mahi Workforce Data 2022 — Conditions of employment
-
6.2
Raraunga Ohumahi 2022 — Te hauora i roto i te mahi Workforce Data 2022 — Wellbeing at work
-
6.3
Raraunga Ohumahi 2022 — Te whakataurite oranga me te mahi Workforce Data 2022 — Balancing life and work
-
6.4
Raraunga Ohumahi 2022 — Te nekeneke Workforce Data 2022 — Mobility
-
6.5
Raraunga Ohumahi 2022 — Wairua Whakarato Workforce Data 2022 — Spirit of Service
-
6.6
Raraunga Ohumahi 2022 — Te āheinga Workforce Data 2022 — Capability
-
6.1
-
Section 07
Data drilldowns and technical guidance 2022
The data we collect provides us with information on the Public Service gender pay gap, pay by gender and ethnicity and ethnic pay gaps.
Public Service gender pay gaps
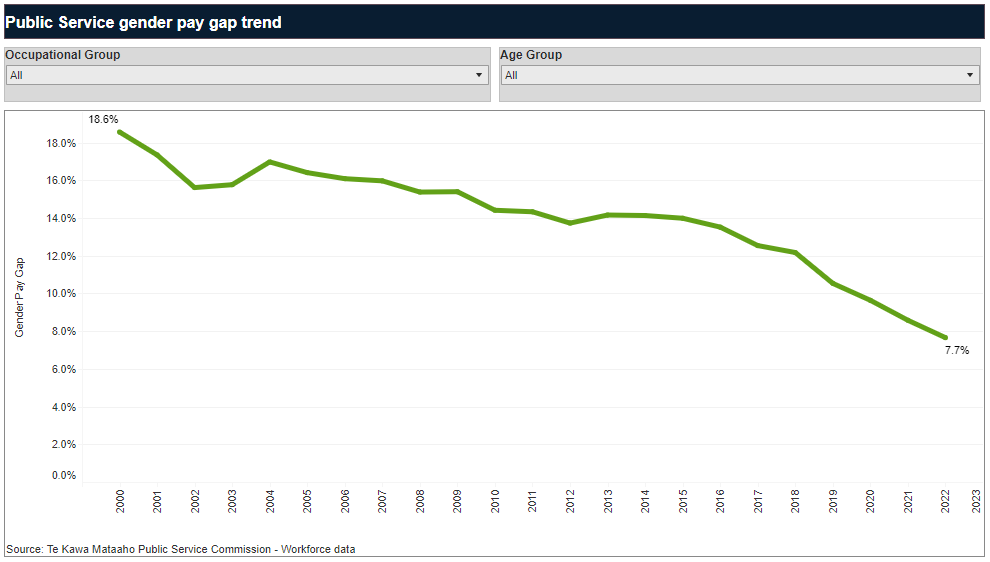
The gender pay gap in the Public Service has continued to decrease. As at 30 June 2022, the average salary was $95,400 for men and $88,100 for women, up 3.0% for men since 30 June 2021 and up 4.1% for women. This means the gender pay gap decreased by 0.9 percentage points to 7.7%.
Contributing to the decline in the gender pay gap is the record high female share of senior leaders, at 55.8%.
Analysis of the Workforce Data has generated the following insights:
- Pay gaps in general are lower when people in equivalent roles are being compared. For this reason, gender pay gaps tend to be lower for specific occupations than the overall gap. For example, the gender pay gap for senior leaders is 5.0% for 2022. This is lower than for all management roles (6.5%) and the Public Service as a whole (7.7%).
- Age groups under 40 years have gender pay gaps of under 5%. Gender pay gaps increase with age, starting from 1.5% for those aged 20 to 24 and rising to 11.4% for those aged 60 to 64.
- Gender pay gaps vary greatly among departments, ranging from 25.0% in the Ministry of Defence to -3.5% in Oranga Tamariki (a negative gender pay gap means women were paid more than men).
- Differences in the gender pay gap across departments are generally driven by the extent to which departments have gender imbalances in their workforces, and this is influenced a lot by whether they operate in traditionally male or female dominated sectors. For example, some traditionally male fields (such as IT or procurement) tend to be highly paid, whereas lower paid clerical and contact centre roles tend to be female dominated. This occupational segregation — women being more likely to be working in lower-paid occupations — is a key driver of the gender pay gap for many departments.
- There can be compositional differences between the genders in terms of seniority and experience within occupational groups as well, although there is evidence that these gaps are reducing. For example, women made up 58% of policy roles at the advisor level in the Public Service in 2012, versus 34% of principal advisor positions. This gap has narrowed substantially by 2022, with women making up 61% of roles at advisor level and 55% at principal advisor level.
Gender pay gap comparison
The Public Service Commission has reported the Public Service gender pay gap using average (mean) pay since 2000. This differs to Stats NZ’s approach of using median pay when reporting the gender pay gap for the entire workforce.
Measuring the gender pay gap — Stats NZ
Median pay is the middle amount of pay earned — half of employees earn less and half earn more. Median pay better reflects the pay a typical employee receives.
On the other hand, mean pay better reflects employees with very low or very high pay, and the fact that women are overrepresented in the low paid groups and underrepresented in high paid groups. The Public Service gender pay gap using mean pay is shown in the preceding section.
In 2022, the Public Service gender pay gap using median pay was 6.8%. This is up on the three previous years (it was 5.6% in 2021, 5.8% in 2020, and 6.2% in 2019) but still substantially below the 2018 figure of 10.7%. Although male pay increased more than female pay at the middle of the pay distribution in 2022, female pay increased more near the bottom and the top of the distribution.
The gender pay gap using median pay for the entire New Zealand workforce, as reported by Stats NZ, was 9.2% in 2022, almost unchanged from the 9.1% reported for 2021. The graph below shows:
- how the gender pay gap measured using median salaries has generally declined over time for both Public Service (down from 16.7% in 2000) and the overall New Zealand workforce (down from 14.0% in 2000)
- the gender pay gap for the overall New Zealand workforce has plateaued in the last few years
- that despite the latest increase, the Public Service gender pay gap remains substantially below the New Zealand workforce gender pay gap.

Note that the Public Service gender pay gap using median pay is more volatile over time than that using mean pay. The structured nature of pay for many parts of the Public Service workforce, with large numbers of employees receiving the same pay, are driving this volatility in gender pay gaps using median pay.
Pay by gender and ethnicity
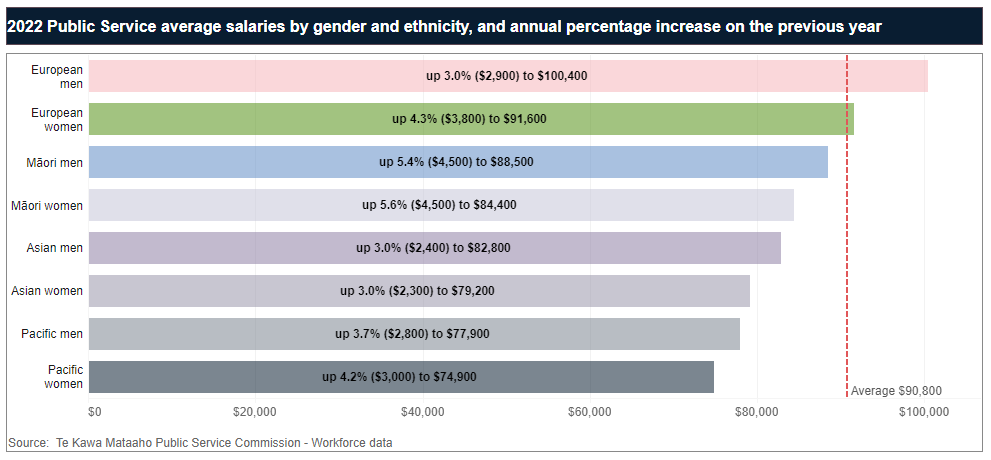
The graph below shows that in the Public Service men are paid more on average than women in each ethnic group, and Europeans are paid more on average than other ethnicities. Pacific women and Pacific men have the lowest average salaries in the Public Service. Overall, the largest percent increases this year went to Māori women and men.
Ethnic pay gaps
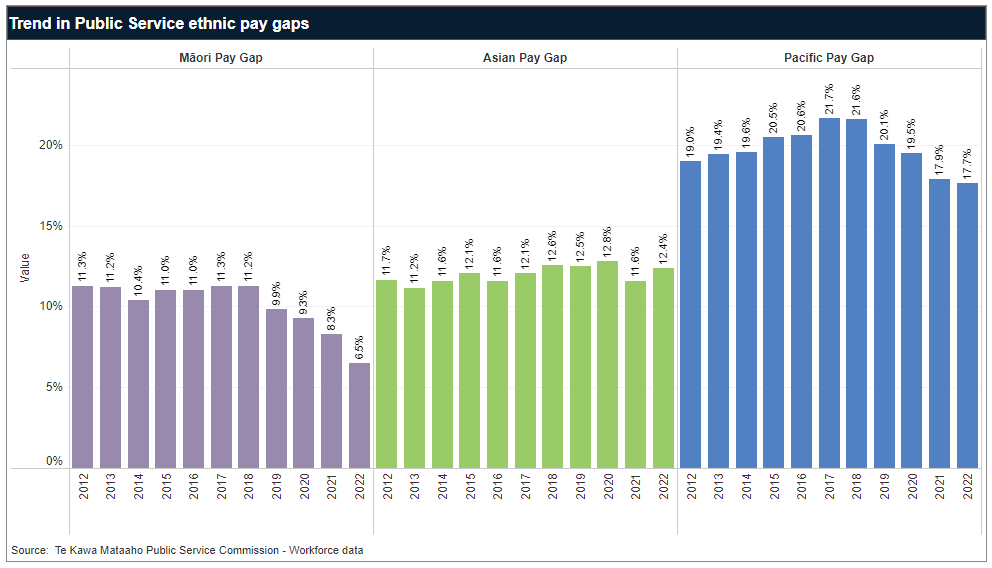
The Māori pay gap (the difference between average pay for Māori and non-Māori employees) has fallen from 8.3% in 2021 to 6.5% in 2022. The Pacific pay gap has fallen slightly from 17.9% to 17.7%. Both the Māori and Pacific pay gaps are the lowest since measurement began in 2000. The Asian pay gap has risen, from 11.6% in 2021 to 12.4% in 2022, partially reversing the improvement last year. There is higher Pacific and Asian representation in younger employees, and this may be slowing improvements in pay gaps.
Like the gender pay gap, ethnic pay gaps can relate to occupational segregation or the occupation profile of a particular ethnic group. Māori, Pacific and Asian public servants are over-represented in lower-paid occupation groups.