-
Section 01
Raraunga Ohumahi 2022 — Kaiārahi Matua Workforce data 2022 — Senior leadership
-
Section 02
Raraunga Ohumahi 2022 — Taiutu Workforce data 2022 — Remuneration/pay
-
Section 03
Raraunga Ohumahi 2022 — Māori Karauna Workforce data 2022 - Māori Crown
-
Section 04
Raraunga Ohumahi 2022 — Ta te rāngai tūmatanui hanga Workforce data 2022 — Public sector composition
-
Section 05
Raraunga Ohumahi — Te Kanorau me te Whakaurunga Workforce data 2022 — Diversity and inclusion
-
5.1
Raraunga Ohumahi — Te iwitanga i roto i te Ratonga Tūmatanui Workforce Data 2022 — Ethnicity in the Public Service
-
5.2
Raraunga Ohumahi — Te Ira Tangata i roto i Te Ratonga Tūmatanui Workforce Data 2022 — Gender representation in the Public Service
-
5.3
Raraunga Ohumahi 2022 — Āniwaniwa Workforce Data 2022 — Rainbow
-
5.4
Raraunga Ohumahi — Hunga whaikaha Workforce Data 2022 — Disability
-
5.5
Raraunga Ohumahi 2022 — Kāhua taipakeke Workforce Data 2022 — Age profile
-
5.6
Raraunga Ohumahi 2022 — Hāhi Workforce Data 2022 — Religion
-
5.7
Raraunga Ohumahi 2022 — Whakaurunga Workforce Data 2022 — Inclusion
-
5.1
-
Section 06
Raraunga Ohumahi 2022 — Te mahi i roto i te Rāngai Tūmatanui Workforce data 2022 - Working in the Public Service
-
6.1
Raraunga Ohumahi 2022 — Paearu mahi Workforce Data 2022 — Conditions of employment
-
6.2
Raraunga Ohumahi 2022 — Te hauora i roto i te mahi Workforce Data 2022 — Wellbeing at work
-
6.3
Raraunga Ohumahi 2022 — Te whakataurite oranga me te mahi Workforce Data 2022 — Balancing life and work
-
6.4
Raraunga Ohumahi 2022 — Te nekeneke Workforce Data 2022 — Mobility
-
6.5
Raraunga Ohumahi 2022 — Wairua Whakarato Workforce Data 2022 — Spirit of Service
-
6.6
Raraunga Ohumahi 2022 — Te āheinga Workforce Data 2022 — Capability
-
6.1
-
Section 07
Data drilldowns and technical guidance 2022
The data we collect shows us wage growth by sector and provides information on the base salaries of staff in the Public Service.
age growth by sector
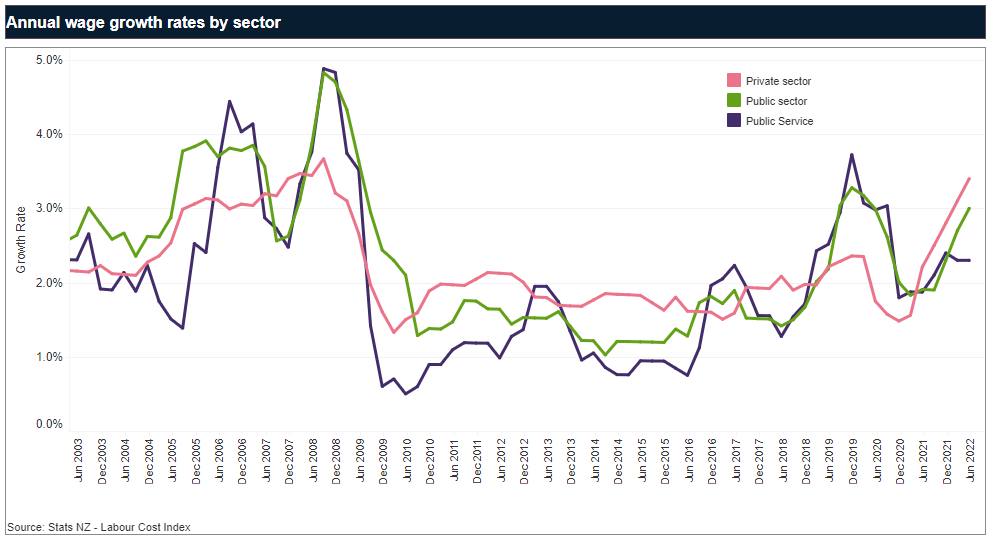
On 28 April 2020, the then State Services Commissioner sent a letter to chief executives in the public sector to outline expectations for pay restraint in their organisations. As a result of this guidance there was low public service wage growth in the December 2020 quarter. The impact of decisions resulting from this guidance was seen in low Public Service wage growth in the December 2020 quarter. Further pay guidance, issued May 2021, has influenced decisions affecting the Labour Cost Index (LCI) from December 2021.
The latest quarterly results from the LCI are available on our Labour Cost Index reporting webpage.
For the year to June 2022, the annual wage rate increase was 3.0% for the public sector and 3.4% for the private sector. The overall rate was 3.4% for all sectors. Inflation, as measured by the Consumer Price Index (CPI), increased by 7.3% for the year to June 2022. Annual private sector wage growth is at its highest level since 2008, and public sector wage growth is at its highest level since 2020. Private sector wage growth generally outstripped public sector wage growth, except from 2018-20, when public sector wages increased more, driven by significant increases in Health and Education.
Within the public sector, annual wage movement to June 2022 in sub-sectors varied:
- Public Service (up 2.3%)
- health sector (up 4.6%)
- education sector (up 2.6%)
- local government (up 3.4%).
Wage increases in the health sector are partially influenced by pay equity negotiations for nurses, which were a feature of the collective agreement settlement for Nurses in December 2021. Wage increases resulting from pay equity settlement should be considered pay corrections, and not pay increases.
The chart on the second tab of the visualisation above, shows the LCI trend in salary and wage movements of selected sectors since March 2010, on a quarterly cumulative basis. Between March 2010 and 30 June 2022 public sector wages increased by 24.2% compared with 27.9% in the private sector. The CPI increased by 27.3% over the same period (excluding the effect of the GST increase on 1 October 2010 from 12.5% to 15%).
Within the public sector, public service wages increased by 21.9%, compared with:
- 23.5% in the education sector
- 28.0% in the health sector
- 27.1% in local government.
1 Stats NZ’s LCI is an official measure of wage inflation. It measures changes in salary and wage rates that employers pay for the same job done at the same standard. The LCI doesn’t reflect compositional change in the workforce, service increments, merit promotions and increases relating to performance.
Annual salary in the Public Service
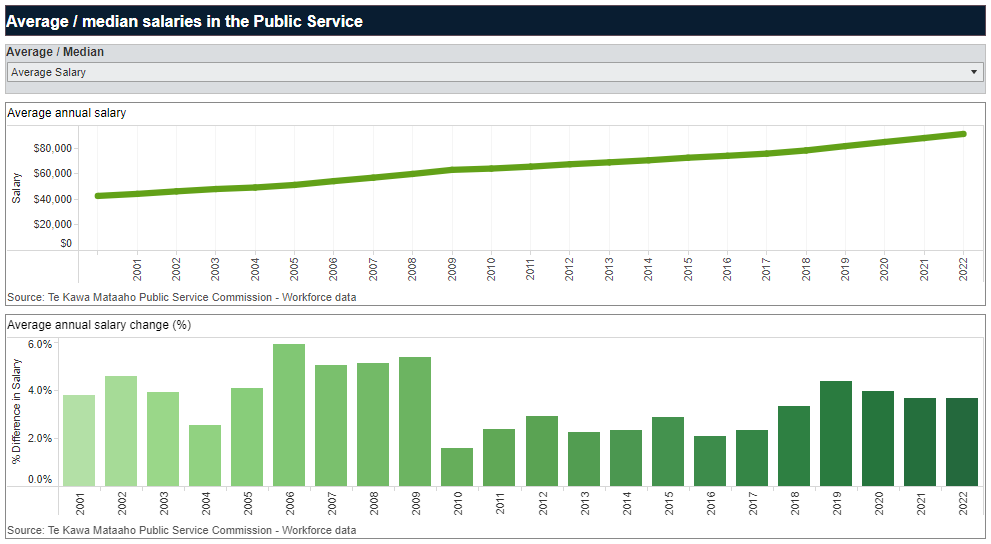
The collection of Public Service workforce data provides information on the base salaries of staff in the Public Service as at 30 June each year. In 2022, the average (mean) annual salary was $90,800 an increase of 3.7% from the previous year. Private sector average earnings increased at a higher rate (7.1%) over the same period — calculated using average total hourly earnings for the private sector from Stats NZ’s Quarterly Employment Survey.
Workforce Data salary movement is affected by:
- changes in the occupational composition of the workforce
- movement in staff pay
- service increments
- merit promotions
- performance-related increases
- salary differences between new and departing staff.
This salary movement is different to the LCI measures discussed in ‘Wage growth by sector’ — LCI is a more refined measure of real wage movement, which controls for the quality and quantity of labour.
The average wage in the Public Service has grown by an average of 3.5% per annum since 2000, and 3.0% since 2010. The trend since 2000 is shown on the chart in first tab of the visualisation below.
Annual salary in the Public Service
Median salaries measure the mid-point of the salary distribution (half of the employees are below or above this salary level). It’s less affected than average salaries by a small number of employees with very high salaries. The median salary for Public Service employees was $79,100, an annual increase of 3.3%. Wage growth has continued to proportionally benefit those towards the lower end and middle of the salary distribution. For example, salary growth at the 5th percentile was 3.3%, while salary growth at the 95th percentile was 2.0%.
Although not a measure of wage growth directly, the composition of the Public Service by salary range over time is an indication of how public servants’ wages are changing. In 2022, the number of public servants who earn less than $60,000 fell 13.8% (1,630 FTE) to 10,150 FTE. Staff earning less than $60,000 now comprise 16.8% of the public sector workforce, down from 25.5% in 2020.
The second tab in the visualisation above shows average salary by occupation group. In the year to June 2022, the increase in average salaries for Managers was 1.6% (0.6% in 2021) compared with 3.2% for staff in non-managerial occupations (4.3% in 2021). Average salaries increased 4.7% for Social, Health and Education Workers, 4.1% for Information Professionals, 3.3% for Clerical and Administrative Workers, 3.2% for ICT Professionals and Technicians, 2.6% for Legal, HR, and Finance Professionals, 2.0% for Inspectors and Regulators, and 2.0% for Policy Analysts. Note that a few of agencies reported changes in how they coded their roles to occupation groups, and this may have affected some of these results.
The third tab in the visualisation above shows average salary by department. Departments that have a higher proportion of staff in operational and service delivery jobs tend to have a lower average salary, for example:
- Ministry of Justice
- Department of Corrections
- Ministry of Social Development
- Department of Conservation
- New Zealand Customs Service.
In contrast, organisations with a larger proportion of staff in leadership, specialist professional and policy roles tend to have a higher average salary, for example:
- Te Kawa Mataaho Public Service Commission
- Ministry of Defence
- Social Wellbeing Agency
- the Treasury
- Ministry of Housing and Urban Development.